Untargeted Chemical Profiling of Two-Dimensional Gas Chromatography Coupled with High-Resolution Mass Spectrometry Data for Botrytized Wines via Topological Data Analysis
Anal. Chem. 2025, 97, 46, 25853–25867: Graphical abstract
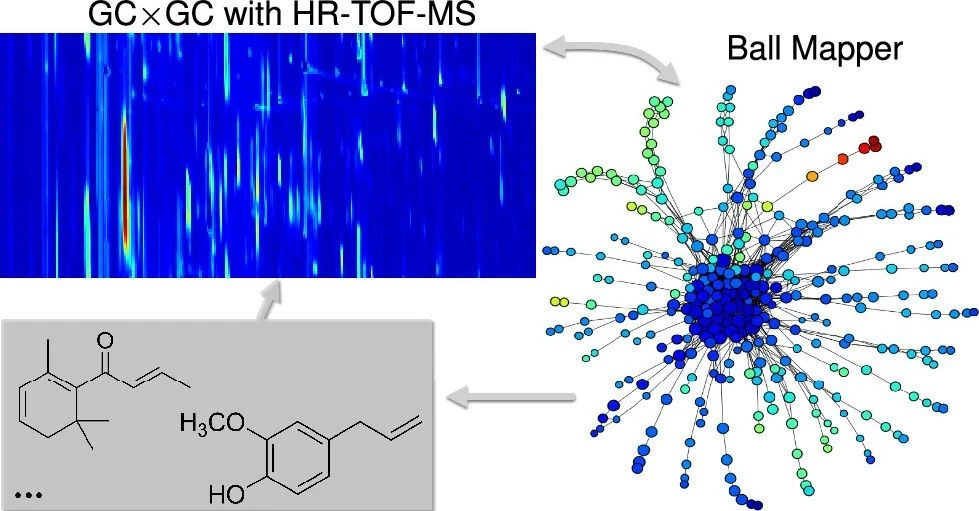
This study introduces a topological data analysis framework based on the Ball Mapper algorithm for untargeted interpretation of complex GC×GC-HRMS datasets. Applied to 34 botrytized wine samples, the approach processed hundreds of thousands of mass spectral signals per sample to identify statistically significant chemical features.
The workflow revealed 1,191 discriminative markers, including 334 identified volatile compounds associated with grape variety, fermentation practices, botrytization conditions, and microbial activity. The results demonstrate the potential of combining topological data analysis with GC×GC-HRMS for advanced chemical profiling of complex natural products and other high-dimensional analytical datasets.
The original article
Untargeted Chemical Profiling of Two-Dimensional Gas Chromatography Coupled with High-Resolution Mass Spectrometry Data for Botrytized Wines via Topological Data Analysis
Nemanja Koljančić, Seol Ah Park, Davide Gurnari, Paweł Dłotko, Jooyoung Hahn*, and Ivan Špánik*
Anal. Chem. 2025, 97, 46, 25853–25867
https://doi.org/10.1021/acs.analchem.5c05342
licensed under CC-BY 4.0
Selected sections from the article follow. Formats and hyperlinks were adapted from the original.
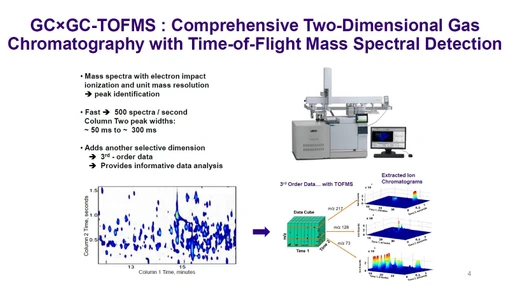
Advanced analysis of complex chemical mixtures, such as biological fluids, environmental samples, and fermented beverages, often relies on comprehensive two-dimensional gas chromatography (GC × GC) coupled with high-resolution time-of-flight mass spectrometry (HR-TOF-MS). (1−3) This powerful analytical platform offers exceptional separation capacity and high spectral resolution, enabling the detection of tens of thousands of ion signals per sample. However, the immense volume and high dimensionality of GC × GC with HR-TOF-MS data, compounded by baseline noise, overlapping peaks, and variation in signal intensities, pose significant challenges for interpretation, particularly in untargeted workflows where relevant features are not known a priori. To address these challenges, we introduce a computational framework for untargeted identification of sample-specific mass spectra in GC × GC with HR-TOF-MS data, based on Ball Mapper which is a topological data analysis (TDA) tool. (4,5) As a case study, we apply the proposed method to a data set of botrytized wines, sweet wines produced from grapes infected by the noble rot fungus Botrytis cinerea. During botrytization, the metabolic transformation of grapes profoundly alters the volatile organic compound (VOC) profile, (6) making these wines a chemically rich and compositionally dynamic model system for evaluating advanced analytical strategies.
A common visual representation of GC × GC for each modulation period is rasterization, which organizes detector events into pixelated columns aligned along the x-axis (first-dimension separation time) and y-axis (second-dimension separation time). (7,8) Although the representation is informative, the process of extracting meaningful features for classification, authentication, or quantitative and qualitative analysis remains time-consuming and risks overlooking critical trace information, particularly in the case of low-abundance VOCs that define sample-specific characteristics. Untargeted chemometric methods such as hierarchical cluster analysis (HCA) and principal component analysis (PCA), as well as supervised approaches such as partial least-squares-discriminant analysis (PLS-DA), are commonly employed to reduce dimensionality and reveal group patterns in complex chromatographic data sets. However, these techniques often suppress sample-specific features during projection, depend on intensive preprocessing and peak alignment, and may miss chemically important signals that lie outside dominant variance directions or predefined chromatographic regions. (2,9)
In response to these challenges, several analytical strategies have been developed that operate directly on peak-level or image-level representations of GC × GC with HR-TOF-MS data. One widely adopted approach is the peak feature method, which aggregates each detected peak with associated metadata, such as retention time, intensity, and spectral profile, into structured tables for downstream analysis. (10) Tile-based methods built on this representation commonly employ Fisher-ratio (F-ratio) analysis to identify discriminative features at low concentration levels. (11−15) Template matching strategies align peaks across samples using spectral similarity and retention thresholds, often referencing composite chromatograms to define feature regions. (16) Workflows such as GC Image Investigator support peak alignment and template construction, and can visualize pointwise differences using color-mapped overlays. (7,9) Digital image (DI) analysis offers a complementary strategy, treating selected chromatographic regions as image segments and applying statistical or machine learning models, such as partial least-squares (PLS) regression or genetic algorithms, for classification or quantification. (3,17) These methods assume a proportional relationship between pixel intensity and analyte concentration, and have proven effective in classifying botrytized wines and authenticating edible oils. (3,18) Despite their utility, these approaches face key limitations. Their effectiveness often hinges on analyst-defined parameters such as tile size or segmentation boundaries, particularly in F-ratio and DI-based analyses. In complex or untargeted studies, fixed-size regions may capture multiple peaks, partial peaks, or overlapping signals, especially when analyte concentrations vary across samples. Furthermore, such methods rarely adapt to peak-specific m/z characteristics, limiting their robustness in chemically diverse or highly variable data sets.
Topological Data Analysis (TDA) has emerged as a powerful framework for exploring high-dimensional chemical data sets, offering a model-free approach to capture intrinsic data structure without relying on linear projections or supervised assumptions. In mass spectrometry imaging (MSI), (19) the Mapper algorithm (20) is applied to pancreatic tissue data and uncovered spatially organized molecular clusters including islet-associated rings and vascular features, missed by standard methods like Uniform Manifold Approximation and Projection (UMAP). (21) The persistent homology is employed to extract noise-resistant features from Matrix-Assisted Laser Desorption/Ionization Mass Spectrometry Imaging (MALDI-MSI) for tumor classification. (22) Earlier, TDA was introduced to the analytical chemistry community, (23) emphasizing its resilience to noise and relevance for large, complex data sets, while its advantages over PCA was demonstrated for interpreting hyperspectral chemical images. (24) Mapper has also been applied to laser ablation MS in geochemical studies, where topological networks was used to differentiate spectral signatures from microfossils and mineral matrices. (25) Despite these promising developments, applications of TDA to comprehensive GC × GC with HR-TOF-MS remain largely unexplored.
In this paper, we introduce a statistically robust and Ball Mapper-based framework for the untargeted analysis of GC × GC with HR-TOF-MS data, addressing key limitations of conventional methods such as PCA, PLS-DA, tile-based F-ratio analysis, and Mapper. (20) Ball Mapper (4) produces a graph of overlapping balls that captures both local and global geometric structure, without relying on linear projections or class supervision. Unlike PCA, which may obscure chemically meaningful variance, (24) or PLS-DA, which is vulnerable to overfitting in small-sample, high-dimensional settings, (26) Ball Mapper captures nonlinear relationships in the full data space. Compared to tile-based F-ratio methods, (12,27) which require careful tuning of segmentation and thresholds, Ball Mapper offers a parameter-efficient alternative that yields interpretable topological summaries. Recent studies in environmental chemistry confirm this promise. Ball Mapper’s advantages over conventional Mapper are demonstrated in pollutant profiling, (28) and further applied to reveal seasonal contamination patterns in landfill leachate. (29) Building on this foundation, we propose a statistically robust framework that identifies representative groups of samples by analyzing consistent clustering patterns across multiple views of the data in high-dimensional space. (30) This approach enhances the interpretability of the analysis and reveals robust structural associations between chemical composition and sample metadata. Although our case study focuses on wines, the method is fully general and applicable to any domains where GC × GC with HR-TOF-MS data are collected.
2. Data Acquisition
2.2. Instrumentation
The samples were analyzed using a Pegasus GC × GC with HR-TOF-MS system (LECO Corporation), comprising an Agilent 7890B gas chromatograph (Agilent Technologies) coupled with a HR-TOF-MS (Leco, San Joseph, USA) and a cryogenic modulator. The chromatographic setup included a 30 m × 0.25 mm × 0.25 μm DB-FFAP column (Agilent Technologies) with a highly polar nitroterephthalic-acid-modified polyethylene glycol stationary phase for the first dimension, and a 1 m × 0.25 mm × 0.25 μm Rxi-17Sil column (Restek) with a medium-polar fused silica stationary phase for the second dimension. Helium (99.999% purity) was employed as the carrier gas at a flow rate of 1 mL/min. The oven temperature program started at 40 °C, held for 10 min, then increased at 2 °C/min to 220 °C, where it was maintained for 5 min. Throughout the analysis, the secondary oven operated 5 °C above the primary oven. The modulator was set to 15 °C above the primary oven with an 8s modulation period, comprising a 2.40 s hot pulse and a 1.60 s cooling phase. The transfer line temperature was maintained at 250 °C. Mass spectrometry was performed with electron ionization (70 eV), an ion source temperature of 250 °C, a detector voltage of 1800 V, a mass range of m/z 29–600, and a data acquisition rate of 100 spectra/s.
4. Results and Discussion
4.2.3. Qualitative Comparison of PCA, UMAP, tSNE, and Ball Mapper
A common strategy to reduce the computational cost of high-dimensional mass spectral data is to apply dimensionality reduction methods such as Principal Component Analysis (PCA), Uniform Manifold Approximation and Projection (UMAP), (21) or t-distributed Stochastic Neighbor Embedding (tSNE). (38) These project
Remark 3. Ball Mapper does not reduce dimension like PCA, UMAP, or t-SNE, but simplifies data by summarizing its structure as a graph that highlights clusters, continuous trends, and their relations. Its primary role is topological summarization and visualization rather than dimensionality reduction.
Figure 7 illustrates these differences in VnMS1. PCA, UMAP, and t-SNE reduce to d̃ = 2, while Ball Mapper is shown at resolution ϵ = 0.2 (chosen for clarity). To enable comparison, node colors correspond to normalized GC × GC intensities in Figure 2b. In PCA, many red- and blue-shaded points overlap, indicating limited separation. UMAP yields curved, intertwined clusters, while t-SNE suggests possible clustering but requires additional clustering step for meaningful summarization. In contrast, Ball Mapper (bottom-right) reveals clusters of similar nMS vectors and their interconnections without dimensionality reduction, offering improved separation and interpretability of distances.
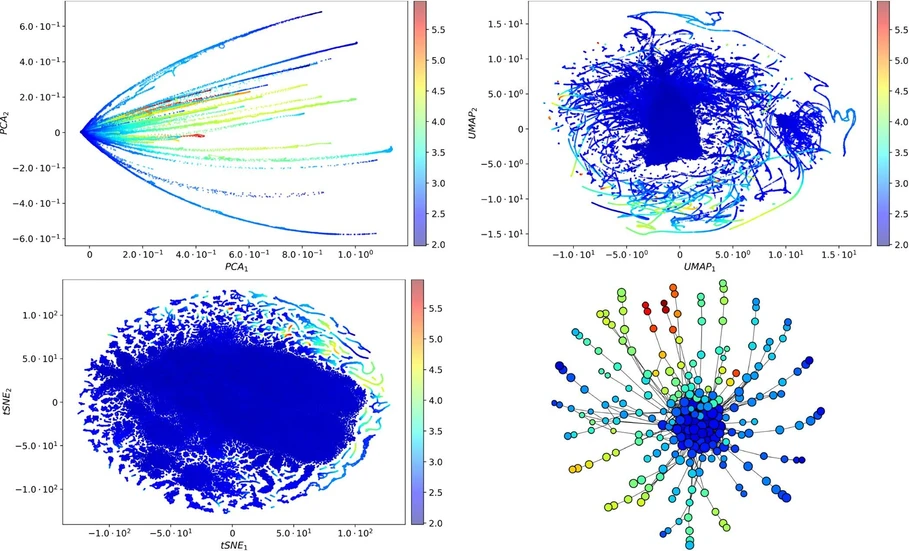 Anal. Chem. 2025, 97, 46, 25853–25867: Figure 7. PCA, UMAP, tSNE, and Ball Mapper of wine k = 1 (Table 1) for VnMS1 (eq 6): The Ball Mapper graph is shown at ϵ = 0.2 for legibility; all analyses elsewhere use ϵ = 0.08; see also Figure 6 for resolution effects.
4.2.6. Chemical Significance of ruMS Vectors in Context of Wines
A central outcome of this study is the demonstration that ruMS vectors can be used as chemically interpretable and statistically discriminative descriptors of complex samples. Unlike principal components or latent variables, each ruMS corresponds to a concrete set of ions (m/z values) from a chromatographic feature that can associate with a particular compound or class of compounds. This gives analysis a high degree of chemical transparency. For instance, rather than simply stating that “PC1 separates French and Tokaj wines,” now it is possible to pinpoint specific ruMS vectors (e.g., a furanone lactone and a methylthio-propanol) that drive this separation and relate them to known enological characteristics. The ruMS vectors identified by Ball Mapper effectively bridge multivariate statistics and chemical knowledge. Many of the discriminative ruMS correlate with known compound classes and regional wine origins: e.g., terpene-derived odorants were predominantly found in the Tokaj wines, whereas sulfur-containing ruMS vectors (like methylthio-propanol) were more characteristic of Sauternes, reflecting differences in grape variety and Botrytis strain metabolism between regions. Likewise, higher levels of phenolic ruMS (such as oak lactones and phenol derivatives) were noted in Tokaj region samples that undergo extensive barrel aging, versus higher alcohol/aldehyde ruMS in Sauternes which can result from different fermentation dynamics.
The utility of ruMS vectors for wine classification is clear in their ability to separate wines by country and even producer. Many ruMS were unique to one origin, acting as “fingerprint” compounds linked to terroir and vinification. For instance, C6–C10 ethyl esters strongly indicated Tokaj wines (enriched by the putňa process), while specific thioethers or lactones pointed to Sauternes (from Botrytis cinerea). Representative groups of wines from ruMS vectors revealed not only which features differ but also how they shape aroma profiles reflecting origin. This is valuable for authenticity studies, as it allows partial ruMS annotations to be informative without full compound identification. The results presented here demonstrate that even tentative assignments, such as a ruMS feature identified as a terpene or furan, provide insight when combined with uniqueness and statistical relevance.
Finally, it is important to acknowledge that a considerable fraction of features in these rich data sets remain unidentified by spectral libraries. This highlights both a challenge and an opportunity. The challenge is that untargeted analysis of complex natural products (such as noble rot wines) will inevitably encounter novel or poorly cataloged compounds, and full identification of all characteristics is impractical. The opportunity lies in the fact that ruMS profiling allow us to still extract value from these unknowns. By classifying unknown ruMS by their discrete mass spectral fragmentation patterns and retention characteristics, it was possible to group them into plausible chemical families (terpenoids, norisoprenoids, medium-chain acids, etc.). These groupings help formulate hypotheses about how botrytization or regional winemaking traditions influence the VOC profile of the wine. Thus, even without full identification, ruMS features contribute to a deeper mechanistic understanding of the chemical terroir. Going forward, the most informative of these markers (for example, a Tokaj-specific unknown furanone or a Sauternes-specific sulfur compound) can be prioritized for targeted structure elucidation or synthesis. This data-driven selection of such features can greatly focus future studies, reducing the analytical burden by highlighting a short list of high-impact compounds.
It revealed stable sample clusters reflecting real-world categories, similar to PCA or PLS-DA, while preserving chemical detail. At the same time, it identified key spectral features driving these differences, as in targeted biomarker analysis, but through an unsupervised, discovery-based approach. This dual outcome exemplifies how the proposed algorithm can complement traditional chemometric strategies: by preserving the integrity of the chemical information (rather than compressing it into abstract variables), it was possible to obtain results that a chemist can directly interpret and validate. The ruMS vectors identified here not only discriminate the wines statistically but also map onto known VOC classes linked to grape variety, fermentation, aging, and regional terroir.
5. Conclusions
We developed a structured workflow to apply Ball Mapper to high-dimensional spectral data. Raw mass spectra were transformed into normalized vectors (nMS), from which representative spectral vectors (rMS) were extracted using Ball Mapper. Relatively unique spectral vectors (ruMS) were then identified as points geometrically distant from other samples, capturing sample-specific traits. To assess reproducibility, frequency matrices from randomized Ball Mapper views quantified how consistently ruMS vectors occupied regions in high-dimensional space. These matrices enabled hierarchical clustering and the identification of representative groups (RGs) of samples sharing stable topological features. This dual-level interpretation─at both feature and sample levels─provides a robust, untargeted, and noise-tolerant framework for GC × GC–HR-TOF-MS data. Although demonstrated on wines, the approach is general and applicable to any chemically diverse system with chromatographic mass spectral data, enabling chemists to link spectral structure with metadata in a unified framework.
Ball Mapper further enabled data-driven selection of informative compounds for targeted analysis, reducing computational cost while retaining chemical relevance. The framework complements classical chemometric tools by revealing patterns not captured by PCA or PLS-DA and is broadly applicable to environmental, food, and biological mixtures. Even partial feature annotation, when guided by this statistical–topological approach, can yield valuable insights into complex chemical systems. Overall, our results demonstrate that integrating TDA with analytical chemistry complements established methods and offers deeper understanding of chemical diversity. In wine chemistry and beyond, this synergy of topology, statistics, and chemistry provides a powerful route to disentangle complexity and extract meaning from large analytical data sets.