A Rapid, Antigen-Independent Diagnostic Strategy for Chronic Chagas Disease Based on Serum ATR-FTIR Spectroscopy and Machine Learning
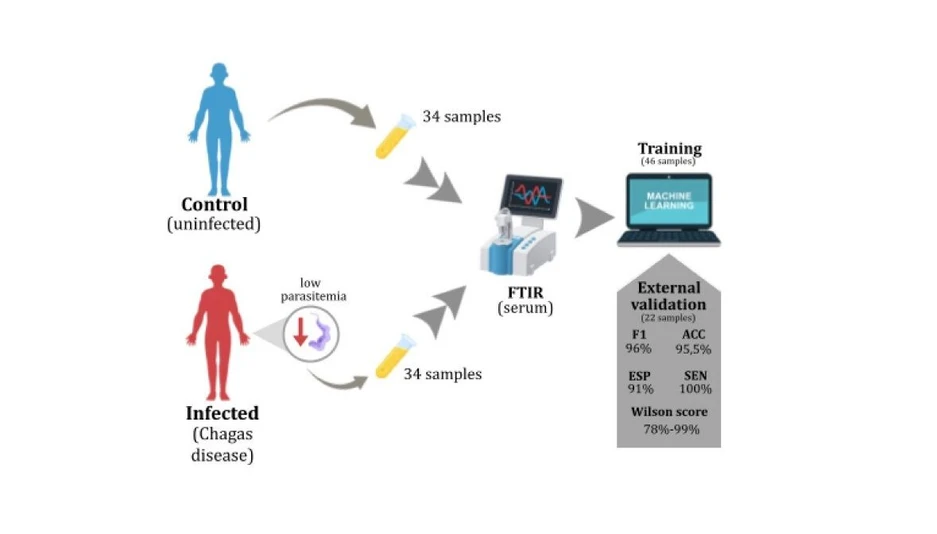
ACS Omega 2026, 11, 23, 34318–34326: Graphical abstract
This study presents a rapid, label-free diagnostic strategy for chronic Chagas disease based on ATR-FTIR spectroscopy of human serum and machine learning. Spectral data were processed using signal filtering, principal component analysis, and support vector machine classification to distinguish infected individuals from healthy controls.
The method achieved 100% sensitivity, 91% specificity, and 95.5% diagnostic accuracy in an independent validation set. Protein-related spectral features, particularly amide I and II bands, were the main contributors to classification, demonstrating the potential of ATR-FTIR combined with artificial intelligence as a fast, scalable, and antigen-independent diagnostic tool for clinical screening and epidemiological surveillance.
The original article
A Rapid, Antigen-Independent Diagnostic Strategy for Chronic Chagas Disease Based on Serum ATR-FTIR Spectroscopy and Machine Learning
Ana Maranni, Thiago Franca, Caique Porsch, Bruno Marangoni, Maria Maranni, Eros de Almeira, Luiz Martins, Paula Andrade, Juliana Ferreira, Solange Domingos, Glaucia Marcon, and Cicero Cena*
ACS Omega 2026, 11, 23, 34318–34326
https://doi.org/10.1021/acsomega.6c01730
licensed under CC-BY 4.0
Selected sections from the article follow. Formats and hyperlinks were adapted from the original.
Chagas disease belongs to the group of neglected tropical diseases recognized by the World Health Organization (WHO) and predominantly affects Central and South America, regions considered endemic. Approximately 6–7 million people worldwide are infected with the protozoan Trypanosoma cruzi (T. cruzi), the etiological agent of Chagas disease, with populations living under conditions of social vulnerability being the most affected. (1,2) This scenario is largely associated with precarious housing, food insecurity, and inadequate sanitation, which favor infection through contact with triatomine insect vectors and their excreta.
In South America, significant progress has been achieved following the establishment of surveillance networks in endemic regions. Uruguay (1997), Chile (1999), and Brazil (2006) were the first countries to receive certification from the Pan American Health Organization (PAHO/WHO) for the interruption of vectorial transmission of Chagas disease by Triatoma infestans. These achievements resulted from public policies focused on vector control, housing improvement, and insecticide application. Nevertheless, alternative transmission routes, particularly oral transmission and vertical (congenital) transmission, remain prevalent in these countries. (3) In addition, increased migration to nonendemic regions and ongoing climate change have expanded the geographic risk of infection. As a result, nonendemic countries such as the United States, Canada, Japan, Australia, and several European nations currently report annual cases acquired through congenital transmission, blood transfusion, or organ transplantation. (4)
During the acute phase, most infections are asymptomatic, and diagnosis relies on the high parasitemia characteristic of this stage, typically achieved through direct parasitological detection of the parasite in blood samples. After several weeks, untreated individuals progress to the chronic phase, which may manifest as indeterminate, cardiac, digestive, or mixed (cardiac and digestive) forms. The chronic phase is characterized by low or undetectable parasitemia, making direct detection unreliable. Consequently, diagnosis relies primarily on conventional serological methods, including indirect immunofluorescence (IIF), indirect hemagglutination assay (IHA), and enzyme-linked immunosorbent assay (ELISA). Molecular methods, such as polymerase chain reaction (PCR), which target parasite DNA, offer higher sensitivity and are often used to resolve discordant or inconclusive serological results. (5−7)
Immune responses during both phases of Chagas disease have been extensively investigated. However, studies addressing the acute phase are largely based on experimental models, which limits their direct extrapolation to human disease. In contrast, investigations of the chronic phase are essential for diagnostic purposes, as they are grounded in the host’s cellular and humoral immune responses. Chronic infection is marked by an intensified cellular immune response, particularly reflected by increased frequencies of T lymphocytes (CD4+ and CD8+ subsets). The activation and maturation of innate and adaptive immune cells are mediated by cytokines, which are present at elevated levels during this stage. These signaling molecules play a crucial role in shaping the humoral immune response, promoting the production of specialized antibodies, predominantly immunoglobulin G (IgG). Among the most representative cytokines are interleukin-10 (IL-10), interleukin-5 (IL-5), interferon-gamma (IFN-γ), and tumor necrosis factor-alpha (TNF-α), reflecting the coexistence of pro- and anti-inflammatory responses. In addition to host-derived immune mediators, parasite-derived proteins also influence the immune response, including surface mucins and antigens released following parasite lysis. (8,9)
Within this context, molecular optical spectroscopy techniques offer a valuable approach for investigating biofluids such as blood serum, which is predominantly composed of immune-response-related biomolecules. Due to its high sensitivity to sample composition, Fourier-transform infrared (FTIR) spectroscopy has been increasingly combined with machine learning (ML) algorithms for the investigation of infectious diseases. Numerous studies have reported diagnostic accuracies exceeding 90% using FTIR-based approaches, establishing robust analytical protocols for continued development in this field. (10−14) Compared with conventional serological assays, FTIR spectroscopy offers several advantages, including minimal sample preparation, straightforward implementation, and the potential for rapid and high-throughput testing. (15)
A previous study conducted in Brazil by Santos et al. (2025) investigated chronic Chagas disease using FTIR spectroscopy combined with machine learning applied to both liquid and dried serum samples. (16) For dried samples, the best performance was achieved using logistic regression, yielding sensitivity and specificity values of 93%, whereas for liquid samples, the XGBoost model achieved sensitivity and specificity of 87%. (16) Although these results are comparable to those obtained with conventional diagnostic methods, the analytical framework relied on multiple modeling strategies with relatively high algorithmic complexity, which may limit interpretability and generalization. In the same national context, serological assays have demonstrated variable performance: ELISA tests showed sensitivities ranging from 92.9% to 100% and specificities from 78.2% to 90%; IIF assays exhibited sensitivities between 87.4% and 100% and specificities between 62.1% and 88.6%; IHA tests showed sensitivities of 71.2% and 93.7% and specificities of 94.9% and 70.9%; rapid immunochromatographic tests achieved sensitivities between 92.8% and 100% and specificities between 78.5% and 92.4%. (17,18) In this context, the present study advances beyond previous approaches by adopting a more rational and streamlined data analysis strategy, combining dimensionality reduction and a single, well-defined classification model. This simplified yet more robust framework reduces analytical complexity while improving model stability and external validation performance, thereby more clearly revealing the diagnostic potential of FTIR spectroscopy for chronic Chagas disease.
Despite their widespread use, conventional serological assays are hindered by the extensive genetic and antigenic variability of T. cruzi, which complicates diagnosis and limits assay performance for geographically distinct parasite strains. (4−9,17−19) In this context, spectroscopic approaches emerge as a complementary diagnostic strategy, as they align with conventional results while simultaneously providing a global molecular fingerprint of the sample. This feature enables the development of diagnostic protocols that are independent of specific antigens, facilitating disease detection regardless of the infecting parasite strain.
Accordingly, the integration of conventional serological data with computational models derived from spectroscopic information holds substantial scientific and diagnostic value. Such approaches offer opportunities to optimize diagnostic workflows in terms of time and cost, thereby improving healthcare delivery in regions historically characterized by limited access to diagnostic resources. In this study, we explore the combination of ATR-FTIR spectroscopy and machine learning to evaluate its diagnostic potential for chronic Chagas disease using liquid serum samples, which ensure sample compositional homogeneity and facilitate spectral acquisition.
Methods
ATR-FTIR spectra were acquired from liquid serum samples by depositing 20 μL directly onto the attenuated total reflectance (ATR) accessory of an FTIR spectrometer (Agilent Cary 360). Spectral acquisition was performed over the 1800–900 cm–1 range, corresponding to the fingerprint region of biological samples, which contains the most diagnostically relevant vibrational information associated with proteins, lipids, nucleic acids, and carbohydrates. This region is widely used in FTIR-based biomedical studies due to its high sensitivity to biochemical composition and its reduced interference from water absorption compared to higher wavenumber regions. (10−14) Spectra were recorded with a resolution of 4 cm–1 and 64 coadded scans, parameters selected based on preliminary optimization experiments conducted on the instrument. (21) A water background spectrum was collected prior to each measurement to minimize contributions from H2O absorption.
Results and Discussion
Figure 2 shows the average SNV-ATRFTIR spectra of blood serum samples from patients affected by Chagas disease, Figure 2a (red trace), and from the control group, Figure 2b (blue trace). In both cases, high-frequency oscillations can be observed, arising from thin-film interference effects caused by the superposition of internal reflection signals at the interfaces between the ATR crystal, the liquid sample, and air. These oscillations become more pronounced due to the reduced signal intensity obtained when analyzing low-concentration liquid samples, since the generated signal is proportional to the amount of material directly interacting with the ATR crystal. In addition, the curvature of the liquid droplet formed upon deposition of the sample on the ATR crystal introduces variations in the optical path length, further enhancing the interference effects. (29) This phenomenon is accentuated by the inherently low signal associated with the limited concentration of biological material in serum; as only a restricted number of biomolecular components interacts with the infrared radiation, the resulting spectral bands tend to be weak. Moreover, the use of a water background measurement partially removes strong absorption features, further reducing the overall spectral intensity.
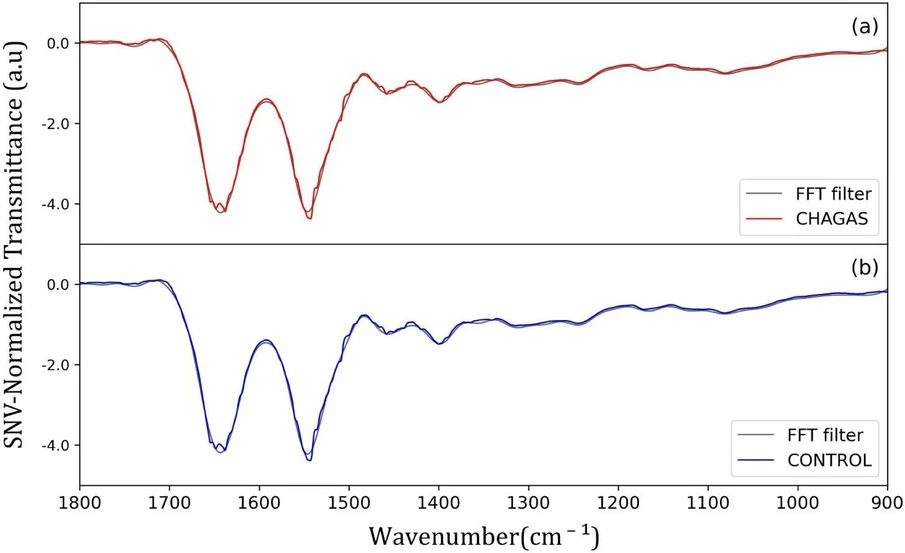 ACS Omega 2026, 11, 23, 34318–34326: Figure 2. Average SNV-ATR-FTIR spectra of human blood serum samples: (a) Chagas disease-infected individuals (CHAGAS) and (b) control subjects. The colored mean spectra (CHAGAS in red and control in blue) correspond to spectra preprocessed by Savitzky–Golay smoothing and fast Fourier transform (FFT) filtering, followed by modified SNV normalization, and are overlaid on the normalized raw spectra for direct comparison.
In the plots, we also display the normalized spectra after Savitzky–Golay (SG) smoothing and fast Fourier transform (FFT) filtering, shown as gray curves. The SG method effectively corrected low-amplitude local experimental noise through curve fitting; however, it had no significant effect on high-frequency noise components. To address this limitation, FFT filtering was applied, enabling the attenuation of interference-related oscillations and yielding spectra in which the relevant analytical information is predominantly represented by low-frequency signals. The resulting adjustment is close to ideal, as illustrated in Figure 2, since the overall spectral shape is preserved.
All spectra presented were normalized using the modified standard normal variate (SNV) method, including baseline correction referenced to the transmittance region around 1800 cm–1, where no analytically relevant absorption features were detected. This preprocessing strategy yielded spectra free from noise-related artifacts and disproportionate amplitude variations. The preprocessing step is essential for multivariate analysis, given the high sensitivity of these methods to data scaling. The use of raw spectra would introduce band intensity as a discriminative factor, leading to inaccurate class differentiation. (30) For proper modeling, the only relevant discriminative information should be the spectral profile─namely band positions and chemical composition─rather than variability associated with differences in biological material concentration.
Figure 5 presents, in the left column, the score plots illustrating the spatial distribution of samples and, in the right column, the corresponding loading plots indicating the contribution of each wavenumber. Visual inspection allows assessment of the discriminative contribution of each principal component: whereas PC1 (Figure 5a) and PC2 (Figure 5b) exhibit clear class separation, PC3 (Figure 5c) shows substantial overlap between groups, indicating limited discriminatory power. Nevertheless, PC3 was retained for model training to ensure that the cumulative explained variance exceeded 85%, thereby preserving the maximum amount of information from the original variables. Subsequent components were discarded, as they predominantly capture residual variance and instrumental noise without contributing meaningfully to class discrimination.
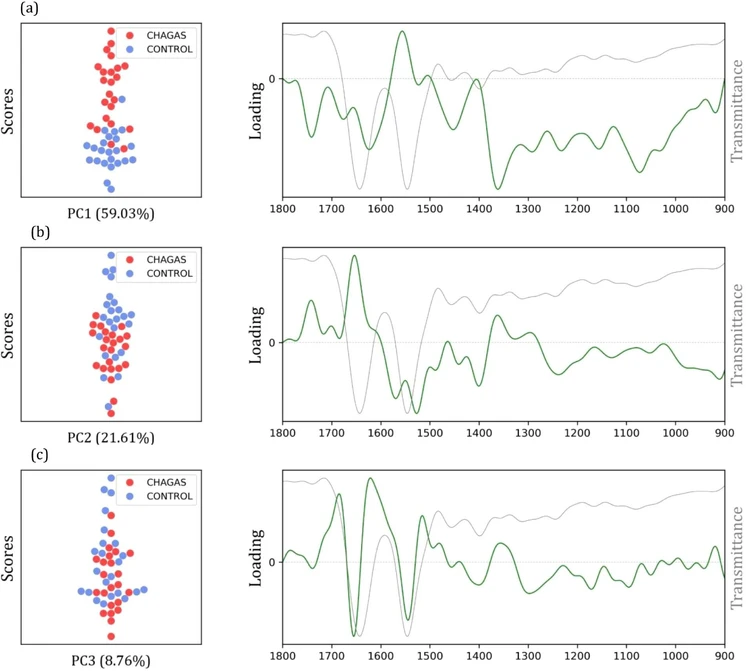 ACS Omega 2026, 11, 23, 34318–34326: Figure 5. PCA score and loading plots obtained from the preprocessed data of control (noninfected) and Chagas disease groups for (a) PC1 explaining 59.03% of the variance, (b) PC2 explaining 21.61% of the variance, and (c) PC3 explaining 8.76% of the variance. In the background of the loading plots, the mean spectrum of one of the groups is displayed to facilitate peak comparison.
Seventy percent (70%) of the data set was allocated for model training, while the remaining 30% was reserved as an independent external validation set. Model construction was performed in the reduced PCA space using the first three principal components (PCs), which together captured approximately 89% of the total variance. Different kernel functions (linear, quadratic polynomial, and cubic polynomial) and regularization parameter values (C = 1, 10, and 100) were systematically evaluated. Hyperparameter selection was guided by performance analysis using leave-one-out cross-validation (LOOCV) applied to the training set, followed by confirmation using the external validation set. The final model was selected based on achieving high accuracy with minimal discrepancy between cross-validation and external validation results, thereby reducing the risk of overfitting or underfitting and ensuring robust generalization.
Conclusion
The results obtained from the ATR-FTIR spectral model, developed to discriminate individuals with Chagas disease from noninfected controls and combined with machine learning, demonstrate strong relevance for diagnostic applications. Using serum samples, the method achieved a sensitivity of 100%, specificity of 91%, and an F1-score of 96%. In addition, Wilson score analysis indicates, with 95% confidence, that the true sensitivity of the method lies within the 78–99% interval. Despite the probabilistic nature of these estimates, independent validation yielded an accuracy of 95.5%, approaching the performance of established reference diagnostic techniques.
The methodology presented here offers a new perspective for rapid, accurate, and low-cost diagnosis of Chagas disease. Within the current diagnostic landscape, this approach represents a valuable complementary tool to conventional methods, such as serological and molecular assays, and may be particularly useful for screening in endemic regions where access to complex laboratory infrastructure is limited. Substantial diagnostic optimization could be achieved through the incorporation of the proposed model into clinical diagnostic protocols for Chagas disease.