Turn Your Data into Chemistry
The volume of GC×GC-TOFMS data can quickly become overwhelming. Thousands of analytes across multiple tables may require months of pixel-level data mining, often complicated by false positives caused by normal chromatographic variation.
ChromaTOF Tile fundamentally changes how GC×GC data are compared and interpreted. Instead of evaluating individual pixels, the software statistically compares tiled regions of chromatograms. Truly significant differences rise immediately to the surface—allowing you to focus on chemical meaning rather than data hunting.
“ChromaTOF Tile is an enabling technology that has reduced our peak picking time from 10 days to 10 minutes.”
Designed for Sample Group Differentiation
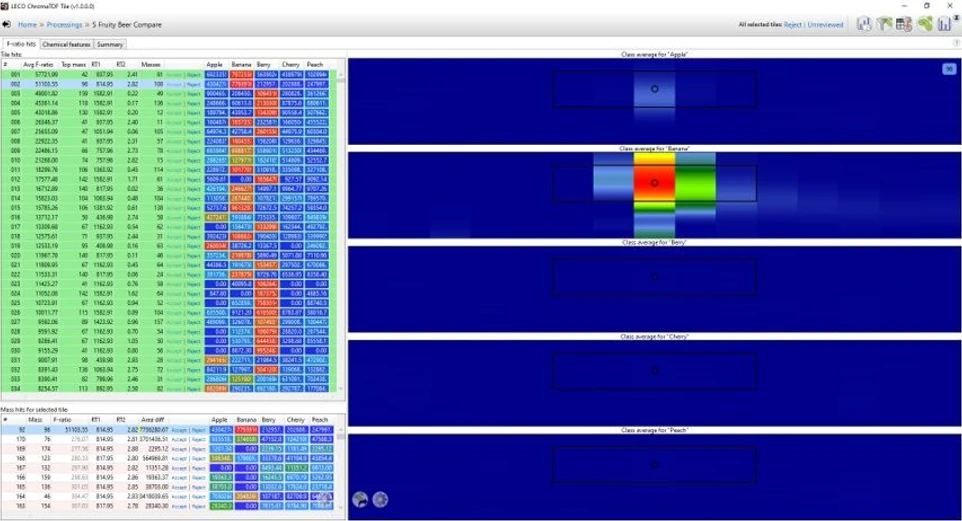
Integrated heatmap tables provide instant visual feedback on relative intensities and variance. ChromaTOF Tile highlights differences between two or more sample classes, including:
- Biomarkers distinguishing healthy vs. diseased samples
- Off-odor detection in food quality control
- Environmental samples upstream/downstream of contamination sources
- Petroleum samples from different geographic origins
- Any complex GC×GC comparison where class differentiation matters
Key Features
- Stand-alone software designed to work in conjunction with ChromaTOF
- Rapid statistical comparison of GC×GC data sets
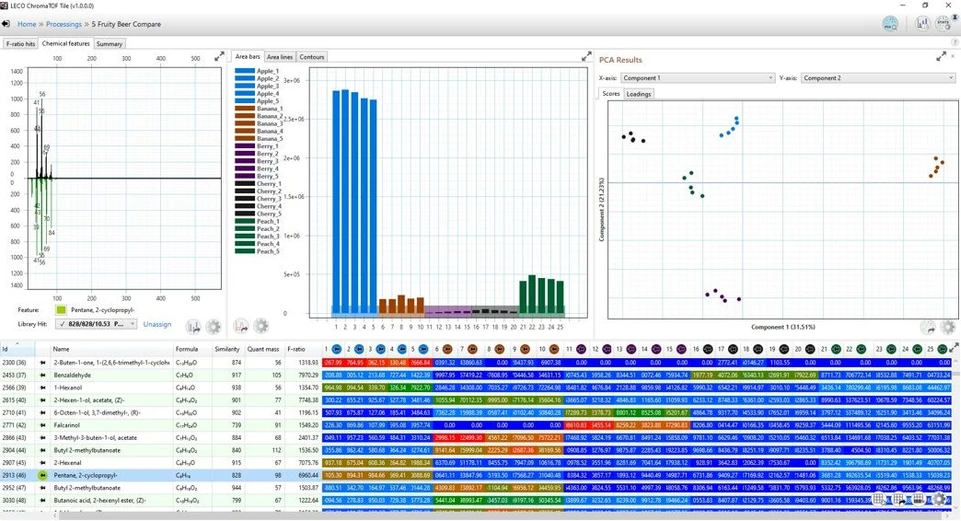
- Exportable tables and plots for efficient reporting
- Clean, library-searchable spectra generated from tiling
- Approximate trend quantification using tile areas
- Reduced false positives from chromatographic misalignment
Theory of Operation
The challenge: Comparing large sets of GC×GC chromatograms is slow and alignment-sensitive, often taking weeks or months even with automated tools.
The solution: In collaboration with Robert Synovec, ChromaTOF Tile applies Fisher ratios to partition chromatograms into regions (“tiles”). Instead of pixel-by-pixel comparison, corresponding tiles are averaged and statistically evaluated.
 LECO ChromaTOF® Tile analytical software
The result is a set of intuitive heatmaps that immediately direct attention to regions of high variance and high analytical relevance—without altering the underlying data.
 LECO ChromaTOF® Tile analytical software