Processing of Accurate Mass GC-MS with NIST26 Chromatogram
- Photo: James Little: Processing of Accurate Mass GC-MS with NIST26 Chromatogram
- Video: James Little: Processing of Accurate Mass GC-MS with NIST26 Chromatogram
NIST 26 introduces an integrated chromatogram processing environment that combines deconvolution, library searching, and accurate-mass data handling within a single workflow. Unlike the standalone AMDIS software, which only supports integer-mass deconvolution, the Chromatogram Window in NIST 26 provides a practical solution for processing accurate-mass GC-MS data while retaining the powerful deconvolution capabilities originally developed for EI spectra.
This guide explains how to process accurate-mass GC-MS datasets, review identifications, evaluate spectral quality, and generate reports using the NIST 26 Chromatogram Window.
Understanding the Accurate-Mass Workflow
Why a New Approach Was Needed
Traditional AMDIS deconvolution was designed for nominal-mass EI spectra and cannot directly process high-resolution accurate-mass data.
To overcome this limitation, NIST developed an internal workflow that:
- Converts accurate-mass ions into encoded integer values.
- Performs deconvolution using the AMDIS engine.
- Converts the encoded values back to their original m/z values.
- Generates deconvoluted accurate-mass spectra suitable for library searching.
This allows users to benefit from established AMDIS deconvolution algorithms while maintaining accurate-mass information throughout the analysis.
Unexpected Benefit
An additional advantage of this approach is improved spectral quality, particularly for low-abundance compounds.
The processing workflow often produces cleaner spectra and better component recovery for trace-level analytes than expected from conventional accurate-mass processing approaches.
Before You Begin
Recommended Prerequisites
Users should already be familiar with:
- Configuring the NIST 26 Chromatogram Window
- Basic navigation within the software
- Library searching fundamentals
- Deconvolution concepts
The accompanying handout also recommends reviewing the NIST 26 configuration and navigation tutorial before working with accurate-mass datasets.
Standalone AMDIS vs NIST 26 Chromatogram Window
Standalone AMDIS remains available and offers features such as:
- Multiple library hits per component
- Comparison of two chromatographic files
- Difference analysis between datasets
However, accurate-mass processing is only available through the integrated NIST 26 Chromatogram workflow.
Step 1 – Configure the Processing Environment
Before processing data:
- Select the appropriate process mode (EI or Tandem).
- Configure all desired processing parameters.
- Save the configuration file (*.ini).
Saving configurations allows users to quickly switch between workflows optimized for different sample types and analytical applications. NIST also provides several default configuration files with the software.
Step 2 – Load an Accurate-Mass GC-MS File
To begin analysis:
- Select Analyze EI High Resolution Input File.
- Choose the appropriate file format.
Supported formats include:
- CDF files
- Accurate-mass JDX formats
- Additional vendor-specific formats supported by NIST 26
The video demonstration uses an accurate-mass CDF file as the input dataset.
Step 3 – Select Search Libraries
NIST 26 supports simultaneous searching of multiple spectral libraries.
Common options include:
- MainLib
- RepLib
- Wiley libraries
- User-generated libraries
Multiple libraries may be searched within a single processing session.
For demonstration purposes, the video uses only:
- MainLib
- RepLib
which are supplied with NIST 26.
Step 4 – Optimize Scan Combination Settings
Accurate-mass datasets frequently contain more scans than are required for effective deconvolution.
NIST automatically estimates the optimal number of scans to combine.
Benefits include:
- Reduced data complexity
- Improved processing efficiency
- Better deconvolution performance
Users can choose among:
- Maximum processing
- Moderate processing
- Fastest processing
Maximum mode provides the most thorough analysis but may require longer processing times for highly complex samples.
Step 5 – Process the Dataset
After configuration is complete:
- Start the analysis.
- Allow NIST 26 to perform deconvolution and library searching.
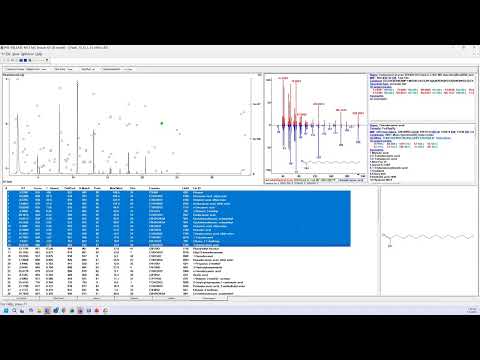
- Review the resulting component list.
The software reports the number of successfully processed components and generates a results table containing:
- Retention times
- Spectral matches
- Match factors
- Relative abundances
- Library identifications
Step 6 – Improve Visualization with Log Scaling
Complex chromatograms often contain numerous low-abundance peaks that are difficult to observe using a linear abundance scale.
To improve visualization:
- Open display properties.
- Change abundance scaling from Linear to Log.
Benefits include:
- Better visibility of trace-level compounds
- Improved inspection of baseline regions
- Easier identification of minor impurities
This is particularly useful for environmental, forensic, metabolomics, and flavor-analysis applications.
Step 7 – Sort Components by Relative Abundance
An efficient review strategy is to begin with the most abundant compounds.
To do this:
- Sort the results table by Relative Abundance.
- Review major components first.
- Progress toward lower-abundance compounds.
This allows rapid assessment of sample composition and data quality.
Step 8 – Select Components of Interest
NIST 26 offers highly flexible component selection tools.
Common approaches include:
- Shift-click for continuous ranges
- Ctrl-click for individual selections
- Filtering by abundance thresholds
In the demonstration, components greater than 1% relative abundance were selected for further review and reporting.
Users can then:
- Create a reduced working list
- Focus on compounds relevant to the study
- Exclude solvents and known contaminants
Step 9 – Review Results Systematically
After creating a component list:
- Sort by retention time.
- Review compounds from low to high retention time.
- Use keyboard arrow keys to move through entries.
For each component:
- Examine retention behavior.
- Review library matches.
- Evaluate spectral quality.
- Check consistency with sample expectations.
The butterfly display in the upper-right panel is especially useful for evaluating spectral agreement between the unknown and library spectrum.
Step 10 – Evaluate Search Quality Using Filters
Several filters can be applied to refine results:
- Filter Score
- Max2Med
- Merge Duplicates
- Best Hits
One particularly useful parameter is:
Max2Med
Defined as:
Maximum abundance ÷ Median abundance of the query spectrum
General guideline:
- Low values indicate more reliable spectra.
- Reliability decreases as Max2Med approaches 10.
Monitoring this parameter can help identify poor-quality or problematic spectral matches.
Step 11 – Verify Accurate-Mass Identifications with MS Interpreter
For deeper validation:
- Right-click a component in the results list.
- Select Send to MS Interpreter.
Important:
Do not launch MS Interpreter directly from the toolbar if you wish to retain accurate-mass interpretation capabilities.
The command must originate from the results table.
What MS Interpreter Provides
The software compares:
- Accurate-mass fragment ions
- Library spectrum
- Proposed molecular structure
Users can review:
- Fragment assignments
- Molecular formulas
- Mass errors
- Parts-per-million (ppm) deviations
For example, the video demonstrates fragment errors near 1.4 ppm, indicating excellent agreement between measured and theoretical masses.
This provides strong evidence supporting the proposed identification.
Step 12 – Export Results to Excel
After finalizing the component list:
- Select the desired entries.
- Right-click.
- Choose Copy Selected Hits to Clipboard.
- Paste directly into Excel.
The exported report can then be:
- Shared with customers
- Used in project reports
- Archived for documentation
- Further processed statistically
The handout demonstrates exporting all components above 1% abundance into Excel for reporting.
Best Practices
- Always review spectra manually before reporting.
- Use log-scale abundance displays for trace-level investigations.
- Validate critical identifications with MS Interpreter.
- Monitor Max2Med values for spectral quality assessment.
- Save workflow configurations for repeat analyses.
- Use retention-time sorting during final review.
- Export only verified compounds into reports.
Conclusion
The NIST 26 Chromatogram Window provides an effective solution for accurate-mass GC-MS data processing by combining high-resolution spectral information with AMDIS deconvolution and integrated library searching. The workflow simplifies component identification, improves detection of low-level compounds, supports accurate-mass validation through MS Interpreter, and offers flexible reporting capabilities. For laboratories working with high-resolution GC-MS data, it represents a significant advance over traditional standalone deconvolution workflows.