Basics of Chromatogram Integration in Clarity Chromatography Software
- Photo: DataApex: Basics of Chromatogram Integration in Clarity
- Video: DataApex: Clarity Tutorial - Peak Integration Overview
Introduction
This article provides a structured, technical explanation of the basic chromatogram integration workflow as demonstrated in a tutorial video for Clarity Chromatography Software. The focus is on the Wave integration algorithm, although the general principles described apply equally to the Legacy algorithm available in Clarity.
Overview of Integration in Clarity
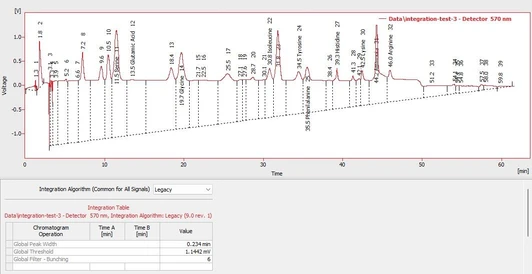
In Clarity, chromatogram integration is performed from the Chromatogram window, using the Integration tab. Integration parameters are defined through a structured table, where each row represents one integration event or operation.
Clarity offers two integration algorithms:
- Wave algorithm – modern, adaptive peak detection method (used in this guide)
- Legacy algorithm – traditional algorithm retained for compatibility
Although parameter names and behavior may differ slightly, the overall integration workflow remains consistent.
Typical Integration Workflow
Chromatogram integration in Clarity follows a logical, multi-step process. In most cases, the first three steps are sufficient to obtain correct and reproducible peak integration.
Step 1: Define the Integration Interval
The integration interval specifies the time range of the chromatogram that will be evaluated. Any signal outside this interval is ignored during peak detection and quantification.
Key points:
- The interval is selected graphically in the chromatogram
- After applying the integration function, Clarity automatically creates a new row in the integration table
- Start and end times are taken from the graphical selection
- All values in the integration table remain manually editable, allowing precise fine-tuning
This step ensures that irrelevant regions (e.g. solvent front, column wash, late noise) do not influence peak detection.
Step 2: Enable Detection of Negative Peaks
If the chromatogram contains negative peaks (for example, due to detector behavior, background subtraction, or specific analytical techniques), the Detect Negative Peaks option must be enabled.
Failing to activate this function will cause negative peaks to be ignored during integration, potentially leading to incomplete or incorrect quantification.
Step 3: Adjust Global Integration Parameters
Global parameters define how peaks are detected across the entire integration interval. These settings establish the fundamental sensitivity and selectivity of peak detection.
Global Peak Width
- Represents the narrowest expected peak
- Used internally to determine peak bunching and separation
- Critical for distinguishing closely eluting peaks
Global Threshold
- Defines the noise level
- Signals below this threshold are considered noise and ignored
- Proper adjustment prevents false peak detection
Global Baseline Slope
- Controls how peak start and end points are determined
- Helps adapt integration to sloping or drifting baselines
In most routine applications, correct adjustment of these global parameters is sufficient for reliable peak integration.
Advanced Integration Adjustments
When global settings alone are not adequate, Clarity provides additional tools for localized and peak-specific refinement.
Step 4: Apply Local Integration Parameters
Local parameters apply only to a selected time range within the chromatogram. This approach is useful when:
- Peak shapes vary across the run
- Specific regions require different sensitivity
- Overlapping or poorly resolved peaks occur locally
Clarity assists the user by suggesting suitable parameter values, which can then be accepted or further refined.
Step 5: Peak-Specific and Baseline Operations
For final fine-tuning, Clarity allows the use of:
- Peak-specific parameters
- Baseline operations
These operations target individual peaks or baselines and are typically applied to:
- Correct peak start/end points
- Handle unusual peak shapes
- Improve consistency for critical analytes
This step is generally reserved for complex chromatograms or validated methods requiring strict control over integration behavior.
Integration Table Logic and Execution Order
Each row in the integration table represents one integration event. The order of rows is critical:
- Integration events are applied from top to bottom
- Later rows can modify or override results of earlier operations
- Careful ordering ensures predictable and reproducible results
Multi-Signal Chromatograms
In chromatograms containing multiple detector signals:
- Each signal has its own integration table
- Integration parameters must be adjusted independently for each signal
This ensures correct peak detection and quantification across all recorded signals.
Transferring Integration to Methods and Other Data
Once the integration setup produces satisfactory results for a representative chromatogram, the completed integration table can be:
- Transferred into the analytical method
- Reused for other chromatograms measured under the same conditions
This enables consistent processing, supports method validation, and improves long-term reproducibility.
Conclusion
Chromatogram integration in Clarity follows a structured and logical workflow, beginning with definition of the integration interval and global parameters, and progressing—only if necessary—to local and peak-specific adjustments.
In most routine applications:
- Integration interval
- Negative peak detection
- Global parameters
are sufficient for reliable quantification. Advanced operations provide flexibility for complex or demanding chromatographic scenarios.
Understanding the hierarchy and execution order of integration events is essential for building robust, transferable methods and achieving consistent analytical results.
-4_s.webp)