Tile-based Fisher ratio of GC×GC-TOFMS data in petroleum samples (Rachel Halvorsen, MDCW 2026)

- Photo: MDCW: Implementing Tile-Based Fisher Ratio Analysis of GC×GC-TOFMS Data to Obtain a Master Peak Table of All Detected Analyte Compounds in Many Petroleum-Based Samples (Rachel Halvorsen, MDCW 2026)
- Video: LabRulez: Rachel Halvorsen: Tile-based Fisher ratio of GC×GC-TOFMS data in petroleum samples (MDCW 2026)
🎤 Presenter: Rachel Halvorsen (University of Washington)
Abstract
Historically, tile-based Fisher ratio (F-ratio) analysis of comprehensive two-dimensional gas chromatography time-of-flight mass spectrometry (GC×GC-TOFMS) data was developed for analysts to obtain a hit list to discover which analytes are top hits that most significantly distinguish the sample classes, with lower F-ratio hits being ignored and/or discarded. To broaden the scope of tile-based F-ratio analysis we explore the ability of the software to discover all analyte components that are detected in a set of samples, taking full advantage of the tiling aspect of the software which mitigates the adverse impact of sample run–to–sample run retention time misalignment.
For this study a set of nine petroleum samples are simultaneously analyzed and statistically compared via p-testing to blank chromatograms to produce one comprehensive hit list. The pin locations and signal areas at the top m/z F-ratio are used together with replicate blanks to generate a master peak table (MPT) that in turn is used to generate sample-specific peak tables (SSPT) for each sample that are naturally retention-time aligned via the F-ratio software. The nine petroleum samples vary to a large extent in the identity and number of analytes present, and a large number of trace analytes were discovered across samples. This workflow also facilitated generating simulated distillation curves for the nine petroleum samples to provide further chemical distribution insight.
Video Transcription
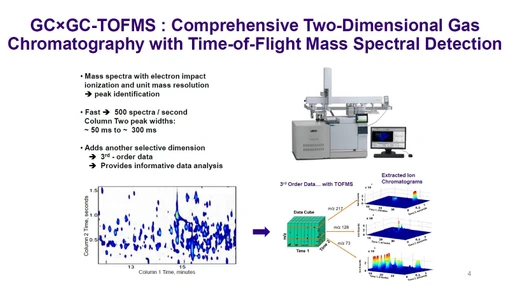
Comprehensive two-dimensional gas chromatography coupled with mass spectrometry (GC×GC–MS) represents a powerful analytical technique for the characterization of complex mixtures such as petroleum-derived products. The enhanced separation capacity achieved through orthogonal chromatographic dimensions significantly increases peak capacity; however, it simultaneously introduces challenges in data processing and interpretation.
This work presents a chemometric workflow designed to generate sample-specific peak tables from GC×GC–MS datasets. The approach was developed in collaboration with industrial partners, including Chevron, with the aim of enabling comprehensive compositional analysis of petroleum samples.
Analytical Strategy and Instrumental Configuration
The analytical method employed a conventional GC×GC separation strategy tailored for petroleum matrices:
- First dimension (1D): Nonpolar stationary phase for separation based primarily on volatility
- Second dimension (2D): Highly polar stationary phase to enhance orthogonal separation
- Modulation: Thermal modulation to transfer effluent from the first to the second dimension
This configuration enables the transformation of complex chromatographic signals into structured two-dimensional datasets, often visualized as folded chromatograms for improved interpretability.
The use of a highly polar second dimension was intentionally selected to maximize separation of chemically diverse analytes. In some cases, controlled “wraparound” effects were accepted, provided that coelution was avoided, thereby increasing effective peak capacity.
Challenges in GC×GC–MS Data Processing
While GC×GC–MS significantly improves separation, it produces a large number of peaks, including:
- High-abundance compounds representing bulk composition
- Trace-level analytes with low signal intensity
- Instrumental background contributions (e.g., column bleed)
Standard peak detection approaches often struggle to:
- Capture low-intensity analytes
- Distinguish true signals from background noise
- Generate reproducible, sample-specific peak lists
These challenges necessitate robust chemometric tools capable of handling high-dimensional datasets.
Chemometric Workflow Overview
The proposed workflow consists of the following key steps:
- Acquisition of replicate datasets
- Three replicates per sample
- Inclusion of blank replicates treated as a separate “sample class”
- Tile-based F-ratio analysis
- Identification of statistically significant features across sample classes
- Tile-based P-test filtering (novel step)
- Determination of analyte presence in individual samples
- Generation of sample-specific peak tables
- Comprehensive list of detected analytes per sample
Tile-Based F-Ratio Analysis
Tile-based F-ratio analysis evaluates the ratio of:
- Between-class variance
- Within-class variance
This metric highlights regions of the chromatogram where signal intensity differs across samples.
Key methodological modification
Unlike conventional approaches, blank samples were treated as an independent sample class. This ensures that:
- Even analytes present at similar levels across all real samples exhibit variance relative to the blank
- Low-contrast but analytically relevant features are retained
Importantly, no F-ratio threshold was applied, allowing retention of both high- and low-variance features for further evaluation.
Detection of Trace Analytes
Visualization of chromatographic data revealed that:
- Linear-scale chromatograms underestimate late-eluting, low-intensity analytes
- Log-scale representation exposes a large population of trace compounds
This observation underscores the importance of including low-intensity signals in comprehensive peak detection workflows.
Tile-Based P-Test for Analyte Confirmation
The key innovation of this work lies in the application of a tile-based P-test to determine whether detected features correspond to true analytes in specific samples.
Method principle
- Signal distributions from blank tiles are used to estimate instrumental background noise
- A Gaussian distribution is assumed for noise behavior
- A confidence interval (e.g., 99%) is established
- Each detected feature is tested against this threshold
Outcome
- Features exceeding the threshold are classified as true analytes present in the sample
- Features below the threshold are considered background or noise
This approach enables objective discrimination between real peaks and background contributions, even for low-intensity signals.
Reproducibility Across Replicates
Analysis of replicate data demonstrated:
- High consistency in analyte classification
- Only ~6.3% of features showed disagreement across replicates
In most cases:
- All replicates consistently passed or failed the P-test
- This supports the robustness of the statistical approach
Generation of Sample-Specific Peak Tables
The final output of the workflow is a sample-specific peak table, representing:
- All confidently detected analytes in a given sample
- Inclusion of both major and trace-level compounds
Notably:
- Approximately 50% of detected peaks correspond to low-abundance analytes
- The number of detected peaks increases with sample complexity
This highlights the ability of the method to capture comprehensive chemical information, including minor constituents.
Advantages of the Proposed Approach
The presented workflow offers several key benefits:
- Retention time robustness due to tile-based analysis
- Improved detection of trace analytes without extensive manual intervention
- Reduced sensitivity to chromatographic shifts
- Applicability to complex mixtures, particularly petroleum products
- Compatibility with commercially available software tools
Furthermore, the approach is adaptable to other chemometric frameworks, including variance-based methods, making it broadly applicable across analytical workflows.
Conclusion
The integration of tile-based F-ratio analysis with a novel P-test filtering strategy provides an effective solution for comprehensive peak detection in GC×GC–MS datasets. By leveraging statistical evaluation of signal versus background, the method enables reliable generation of sample-specific peak tables, capturing both major and trace-level analytes.
This workflow represents a valuable advancement in chemometric data processing for complex analytical systems and offers strong potential for application across a wide range of sample types beyond petroleum matrices.
This text has been automatically transcribed from a video presentation using AI technology. It may contain inaccuracies and is not guaranteed to be 100% correct.