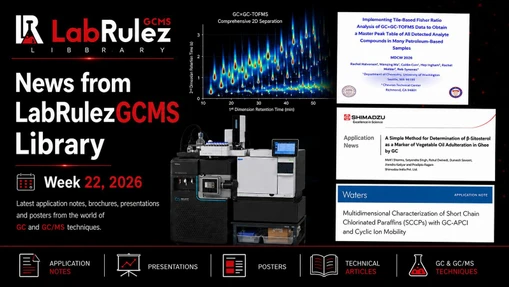
News from LabRulezGCMS Library - Week 47, 2025
LabRulez: News from LabRulezGCMS Library - Week 47, 2025
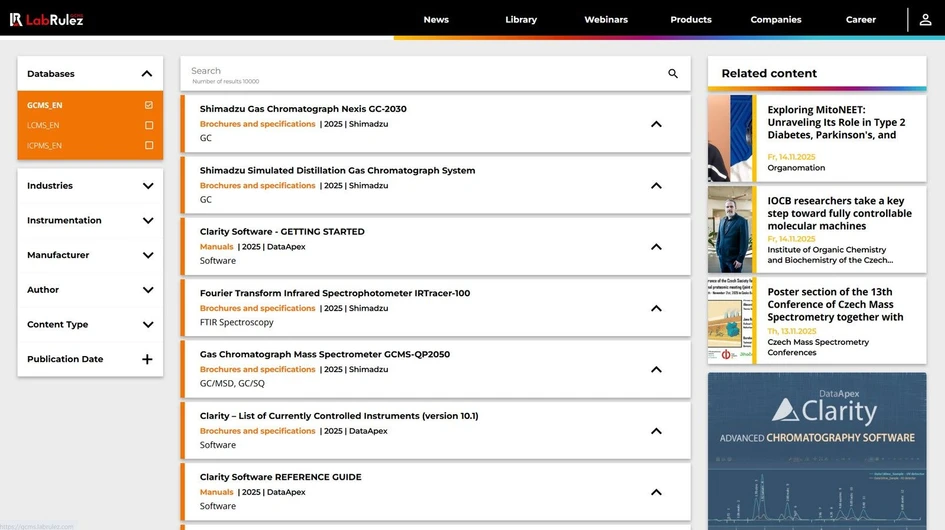
Our Library never stops expanding. What are the most recent contributions to LabRulezGCMS Library in the week of 17th November 2025? Check out new documents from the field of the gas phase, especially GC and GC/MS techniques!
👉 SEARCH THE LARGEST REPOSITORY OF DOCUMENTS ABOUT GCMS AND RELATED TECHNIQUES
👉 Need info about different analytical techniques? Peek into LabRulezLCMS or LabRulezICPMS libraries.
This week we bring you applicaton notes by Agilent Technologies, EST Analytical and Shimadzu!
1. Agilent Technologies: Accurate Identification and Quantification of Pesticide Residues in Ghee
Analysis by QuEChERS with GC/MS/MS using the Agilent 8890 GC and Agilent 7010 GC/TQ
- Application note
- Full PDF for download
India is one of the largest producers of milk, contributing about 23% of global milk production.1 The dairy processing sector includes a wide range of products, such as milk, butter, cheese, ghee, yogurt, flavored milk, lactose-free dairy products, and value-added products like ice creams and yogurts. Amongst these, ghee production is significant because of its popularity, low cost of production, and versatile use. According to the Food Safety and Standards Authority of India (FSSAI), ghee is mentioned as a "product obtained exclusively from milk, cream or butter by a process that almost completely removes water and non-fat solids; it has a specially developed flavor and physical structure".2 Milk‑producing animals can be exposed to pesticides through their diet, such as feed and fodder containing pesticide residues, or through the direct application of pesticides for controlling ectoparasites on their bodies, in animal sheds, and in milk processing areas. Due to their persistent and lipophilic nature, pesticides tend to accumulate in the fat-rich tissues of animals. The FSSAI has specified maximum residue levels (MRLs) for 55 pesticides, and a tolerance limit of 0.01 mg/kg for the remaining pesticides for which an MRL has not been fixed.
Ghee consists of 98.9% fat, irrespective of the animal source. Among the short- and medium-chain saturated fatty acids, all samples contain butyric (C4:0), caproic (C6:0), caprylic (C8:0), and capric acid (C10:0).3 Since its introduction, the QuEChERS method has been widely used for the analysis of pesticides in several matrices. Some modifications to the original QuEChERS method have been introduced to ensure efficient extraction of pH-dependent compounds, to minimize degradation of susceptible compounds (such as base- and acid-labile pesticides), and to expand the spectrum of matrices covered. Ghee matrix has a very high lipid load, making it a difficult commodity for analysis pesticide residues. The primary challenge lies in obtaining an extract that contains the target analytes while minimizing the amount of fat. Co-extracted lipids in the extracts can be removed, to a high degree, by a freezing-out step or a C18 cleanup.
During sample extraction, the sample is often diluted. To obtain a quantification limit of 0.01 mg/kg, the instrument should be able to detect the residues at a lower concentration. This application note addresses these requirements by combining a sample preparation technique covering multiclass pesticides, target-specific multiple reaction monitoring (MRM) data acquisition, and efficient software to simplify quantitative analysis. The Agilent 7010 triple quadrupole GC/MS system enabled trace-level detection and confident quantitation of 150 pesticides in ghee.
Experimental
Equipment
An Agilent 8890 GC coupled to a 7010 GC/TQ system equipped with high efficiency source was used for the analysis. The GC system was equipped with a multimode inlet with air cooling and midcolumn backflush based on an Agilent purged Ultimate union controlled by a pneumatic switching device. The method parameters are displayed in Table 1.
Conclusion
The limits of quantitation (LOQs) for the target list of over 150 compounds ranged from 2.5 to 5 mg/kg for the ghee matrix. To minimize interferences from the ghee matrix, numerous multiple reaction monitoring (MRM) transitions were employed. This approach helped to accurately identify and quantify the target compounds despite the complex sample matrix. The samples were diluted five-fold to ensure that the analytes were within the required detection range of the instrument. This dilution also helped in reducing the matrix effects, leading to more reliable results. The average analyte recoveries were between 70 and 130%, indicating that the method has good accuracy and precision. This range of recoveries demonstrates the method’s robustness and suitability for routine analysis of these compounds.
2. EST Analytical: Analysis of Coffee Flavors by Purge and Trap Sampling
- Application note
- Full PDF for download
Most of us who drink coffee know our preferences. We know which blend we like, what strength and definitely what we like in our coffee. However, most of us do not think about the flavors that go into our coffee that help us define our preferences. Coffee manufacturers, on the other hand are working diligently to create a new blend or a more satisfying flavor that would make us want to choose their coffee over another maker.
This study will look at four different blends of coffee and some of the compounds that contribute to the flavor of the blend. Using purge and trap sampling, the flavor compounds were purged out of the coffee and trapped onto an adsorbent trap. The analytes were then transferred to a Gas Chromatograph/Mass Spectrometer (GC/MS) for analysis. The study focused on six flavor compounds. The spicy smoky aroma of 2-methylfuran, the spicy caramel, almond odor of 5-methylfurfural, the buttery scent provided by the addition of 2,3-butanedione and 2,3- pentanedione and the impact of the two and three methyl butanals giving the dark chocolate malty flavor to the coffee.
Experimental:
The EST Analytical Encon Evolution Purge and Trap Concentrator and Centurion WS Autosampler were interfaced to a GC/MS. The Centurion WS was run in the soil mode and the purge and trap concentrator was configured with a Vocarb 3000 (K) analytical trap. The column selected for this study was an Rtx-1 60m x 0.25mm x 1µm. Listed in Tables 1 and 2 are the experimental parameters used for this study.
Conclusion:
The lightest roast had the most buttery and dark chocolate/malty flavors while the darkest roast had more of the smoky flavor. Surprisingly, the darkest roast and the medium roast had similar proportions of the flavor compounds with the exception of the smoky flavor. While the light roast had large amounts of the flavors tested for, the chromatography of the light roast was much simpler than that of the darker roasts. Overall, the Encon Evolution Purge and Trap Concentrator in conjunction with the Centurion WS Autosampler proved to be an excellent system for sampling coffee. The results were reproducible and provided a lot of information on the flavors of the respective coffees.
3. Shimadzu: Analysis of Ethanol in E10 Gasoline Using Polyarc Microreactor for GC
- Application note
- Full PDF for download
The flame ionization detector (FID) can detect almost all organic compounds, and the sensitivity of the obtained chromatograms displays a correlation with concentration and number of carbon atoms in the compound. However, as a weakness of FID, its sensitivity decreases when an organic compound contains oxygen atoms, asin the case of alcohols.
The Polyarc microreactor improvessensitivity for alcohols and other compounds containing oxygen atoms (hereinafter, oxygenated compounds), allowing calibration using a single compound. Research and use of biofuels has accelerated in recent years, and more sensitive quantitative analysis of oxygenated compounds in multiple compoundsis now required.
This Application News introduces an example of an analysis of a sample simulating E10 gasoline, in which 10 % ethanol by volume concentration was added to gasoline, demonstrating that enhanced sensitivity for oxygenated compounds can be achieved by adding Polyarc to the instrument configuration. The accuracy of the quantitative analysis was also verified using a general standard sample (alkane).
Polyarc Microreactor
Polyarc is a post-column type microreactor that is introduced between the column and the detector (FID). The organic compounds separated and eluted by the column are decomposed to methane by the Polyarc reactor in a two-stage oxidationreduction reaction (Fig. 1). Since the decomposed methane is detected by the FID, the uniform sensitivity for the carbon number can be obtained, regardless of the type of functional groups in a sample.
Effective Carbon Number
As mentioned above, the sensitivity of the FID detector varies depending on the types of functional groups in organic compounds. The detection sensitivity by the FID can be estimated based on the concept of the effective carbon number (ECN), which is an index showing how many carbon atoms in a compound function effectively. Depending on the type of functional groups contained in a compound, the carbon ratio in the molecule changes, and this causes changesin the sensitivity ofthe FID. For example, both ethane (C2H6) and ethanol (C2H5OH) contain the same number of carbon atoms of 2, but the sensitivity of the FID for ethanol is only 75 % of itssensitivity for ethane because the primary hydroxyl group (-OH) behaves as -0.5 carbon atoms in terms of its contribution to the ECN. This meansthe ECNof ethanol is 1.5. Table 1 shows several examples of other functional groups with ECNslowerthan the number of carbon atoms.
Analysis Conditions
In this Application News, sensitivity for ethanol when the Polyarc was added and when using only the FID was compared using an E10 sample, in which 10 v/v% ethanol was added to gasoline, simulating a biofuel which has attracted attention in recent years, and quantitativity for ethanol was confirmed. In the quantitative analysis, it was also carried out by the external standard method using a hydrocarbon (dodecane; C12) with a concentration of 1 w/v% as a standard sample. The analytical instrument was a GC-2030 (SPL/FID) model gas chromatograph with the Polyarc added (Fig. 2). Table 2 shows the analysis conditions.
Conclusion
E10 gasoline was analyzed using an FID detector and an added Polyarc microreactor, confirming that oxygenated compounds can be analyzed with high sensitivity. This study also confirmed that a uniform reaction of organic compounds can be obtained in the FID, and peak broadening can be suppressed by standardizing the response of sensitivity. Table 6 introduces several of the advantages that are possible by adding the Polyarc microreactor. The Polyarc converts all organic compounds to methane having the same number of carbon atoms (mol), enabling highsensitivity detection for compounds with low detection sensitivity by FID alone. In addition, since sensitivity is standardized, quantitation is possible using only one arbitrary calibration curve, regardless of the type of analysis compound. As a result, it is now possible to analyze compounds that were difficult to analyze by FID until now.