How to calculate Signal to Noise ratio in Clarity Chromatography Software

- Photo: DataApex: How to calculate Signal to Noise ratio in Clarity Chromatography Software
- Video: DataApex: How to calculate Signal to Noise ratio in Clarity Chromatography Software
Introduction
Signal-to-noise ratio (S/N) is a critical parameter in chromatography for evaluating peak quality and method sensitivity. The Clarity Chromatography Data System (CDS) includes tools that allow users to calculate S/N directly from chromatograms. This guide explains the complete procedure step by step.
Tools and Requirements
- Clarity CDS software with chromatogram visualization enabled
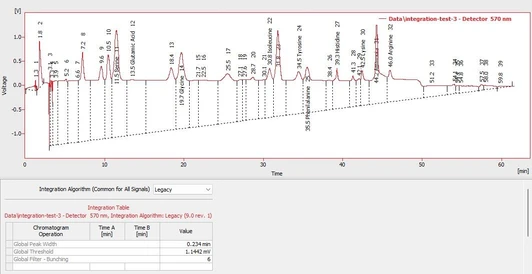
- Chromatogram file containing peaks of interest
- Result Table window for displaying calculated parameters
Step 1: Determining Noise
- Navigate to the Chromatogram → Noise and Drift menu.
- Select Noise Evaluation.
- In your chromatogram, mark an interval that contains only baseline noise (no peaks).
- The software determines the noise value and displays it above the Result Table.
Step 2: Configuring the Result Table
- Right-click inside the Result Table to open the local menu.
- Select Setup Columns to access the configuration dialog.
- Define a new column:
- Name: Enter a descriptive label (e.g., S/N).
- Expression: Input the formula Height / Noise, where Height refers to the peak height and Noise is the variable determined in Step 1.
- Disable the Calculate Total option, as it is not necessary for S/N.
- Confirm with OK to save settings.
Step 3: Viewing Signal-to-Noise Ratio
Once configured, the Result Table automatically calculates and displays the signal-to-noise ratio for every detected peak in the chromatogram. This allows rapid assessment of peak detectability and compliance with method validation requirements.
Discussion
The ability to evaluate S/N directly in Clarity provides several advantages:
- Automation: Removes the need for manual calculations.
- Accuracy: Uses consistent baseline noise determination across the chromatogram.
- Validation Support: Helps confirm method sensitivity in accordance with regulatory guidelines (e.g., ICH Q2, USP).
Conclusion
Clarity CDS offers a straightforward workflow to calculate signal-to-noise ratio for chromatographic peaks. By first defining the noise baseline and then configuring a custom result column, users can quickly assess analytical sensitivity and peak quality.
For further learning and tutorials, additional videos are available on the official Clarity YouTube channel.