Integration Algorithms in Clarity

- Photo: DataApex: Integration Algorithms in Clarity
- Video: DataApex: How to start with global integration setup
Introduction
This document presents:
- a comparison of integration algorithms (IAs) available in Clarity,
- a generally proposed workflow for integrating chromatograms,
- description of functions that are available only in the Wave algorithm.
Integration algorithms are a crucial component of any chromatography software. They identify peaks in a raw chromatographic curve, assign integration marks (starts, ends, apexes), and determine the peak baseline. Although it is the operator's responsibility to verify the correct peak integration after the analysis is finished, an automated peak detection facilitated by the integration algorithm can significantly streamline the workflow.
Clarity since version 9.0 offers two IAs: the original algorithm, renamed Legacy, and a newly introduced algorithm named Wave, which evolved from an experimental algorithm present since version 7.0. The Wave algorithm will be regularly updated with new functions, settings, and bug fixes (updates for Legacy will only be released if a critical bug is discovered). Changes in IAs are always versioned and distinguishable by records in the audit trail.
Choosing an integration algorithm
Users can select either the Legacy or Wave integration algorithm for peak detection. The IA drop-down selection has been relocated to the Integration tab in both the Chromatogram window and the Method Setup dialog, highlighting the interconnection between the algorithm and the integration table.
The introduction of Wave does not affect existing results or methods, as they will remain set to Legacy unless manually altered. Suppose a method was created using an older version of any integration algorithm and was not changed after the Clarity update to a newer version. In that case, the latest version of the same algorithm will be used in any newly measured chromatograms. This change will be logged in these chromatograms upon creation. To address potential issues, DataApex aims to use the algorithm version with the most bug fixes. Users are not required to re-save their methods, but if they do, the change will be logged in the method audit trail.
One way to apply an integration algorithm to multiple chromatograms simultaneously is through the Batch dialog (not applicable to Clarity Lite).
General Comparison
Neither algorithm can be universally deemed superior; some situations may warrant using one IA over the other. Below are some examples of performance differences between the two IAs. At least the Global Peak Width and Global Threshold operations were presumed to be performed on the signal. If you encounter any issues with either of the integration algorithms, please inform DataApex via [email protected]. This datasheet further contains an overview of a basic integration workflow.
Advantages of Wave IA:
- Handling of negative spikes/peaks with regard to baseline placement.
- Handling of shifting baseline/signal.
- Separation of unresolved peaks.
Disadvantages of Wave IA:
- More sensitive to noise, requiring the use of Bunching or another filter in some cases.
- Incorrect integration when peaks of significantly different widths are present (typical for GPC or EA).
Negative spikes/peaks
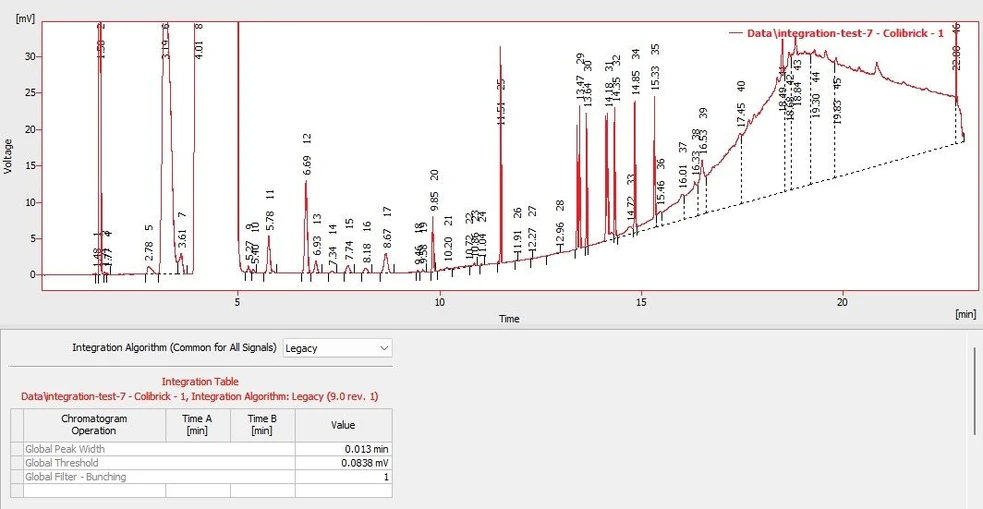
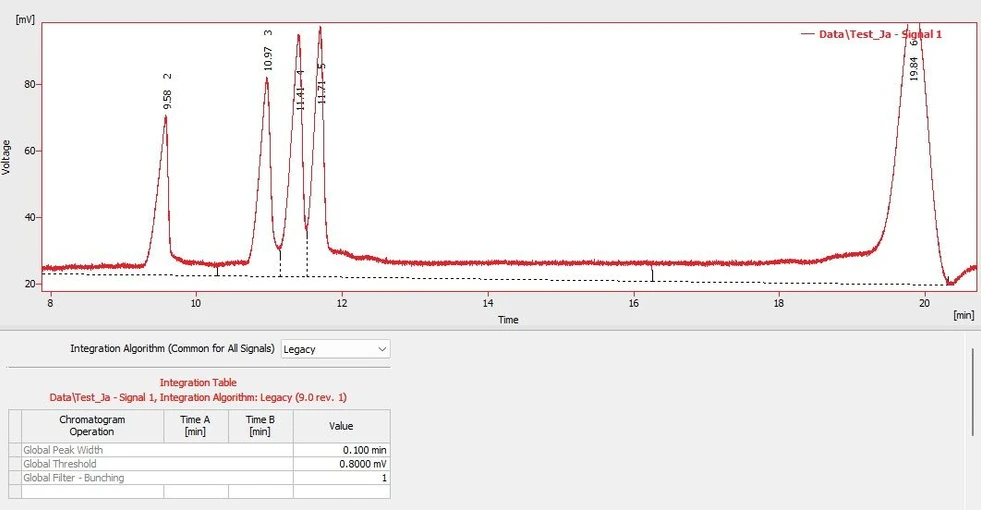
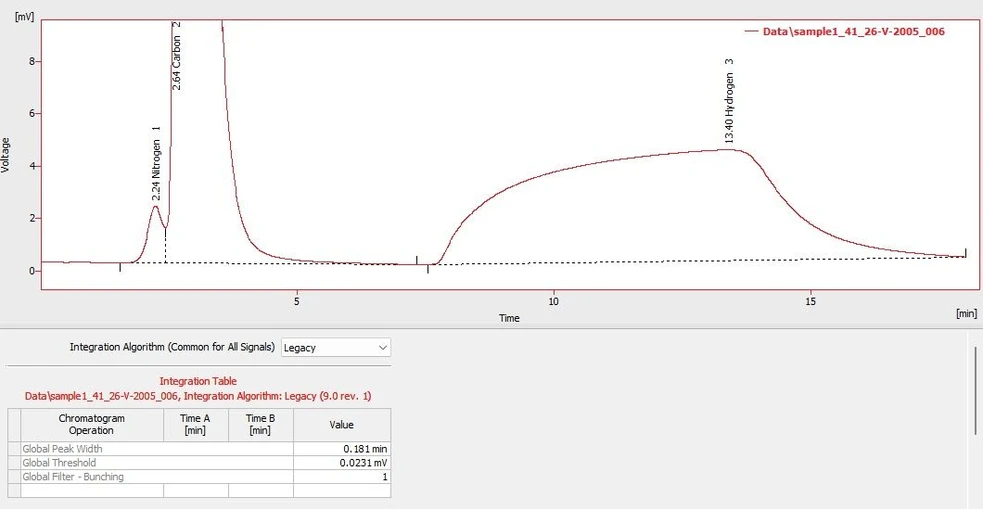
When a chromatogram contains significant negative peaks or spikes that should not be evaluated, the default integration in the Wave algorithm will produce satisfactory results, while the Legacy algorithm will not. (In Legacy, this problem could be solved by applying several Integration Intervals.)
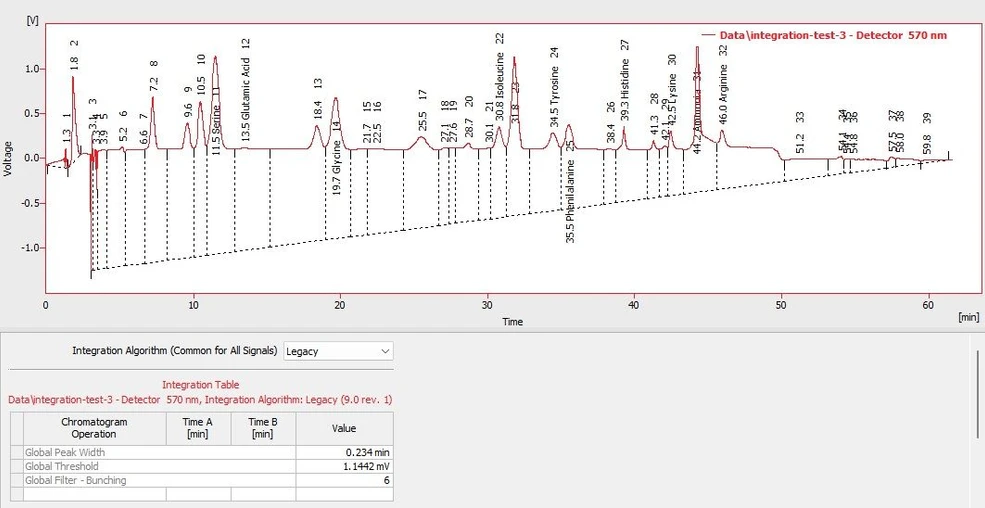 DataApex: Integration Algorithms in Clarity: Figure 1. Integration by Legacy IA considers the negative spike to be the start of the peak (or peak cluster).
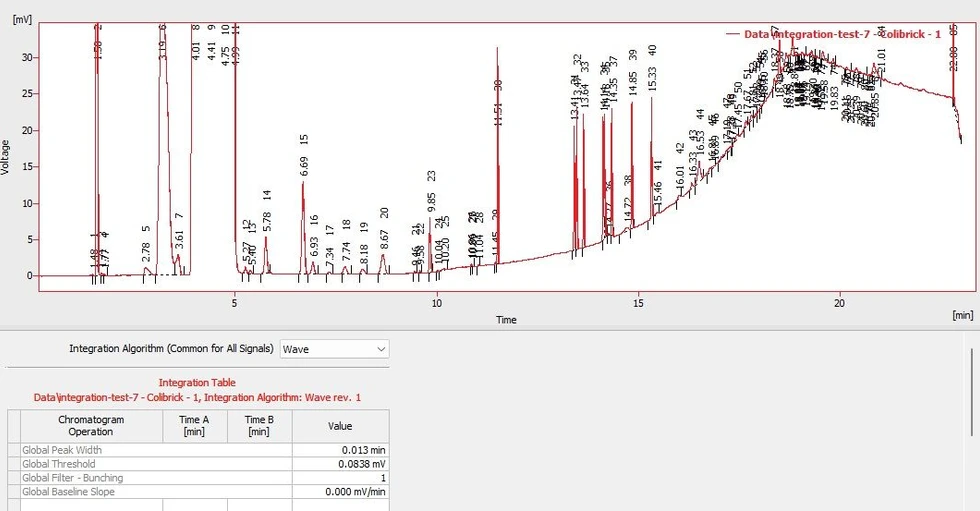
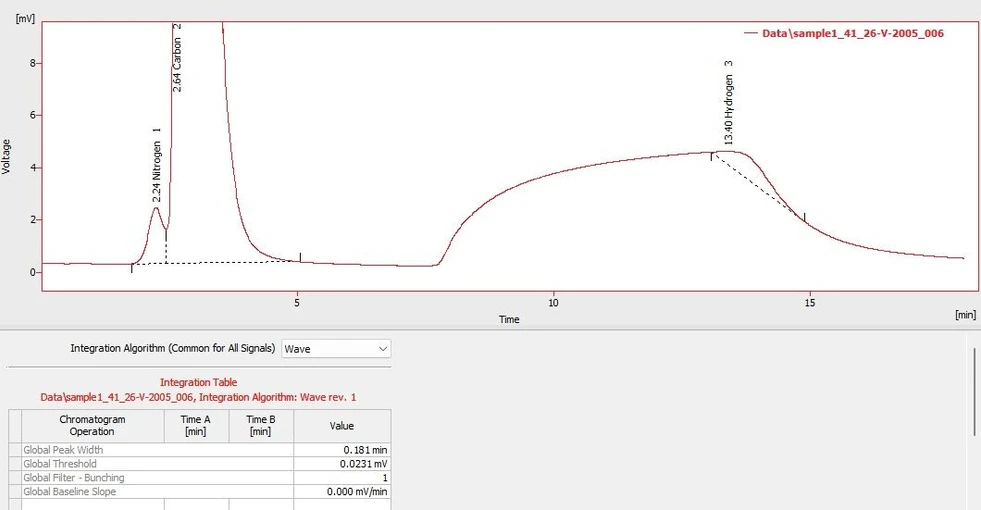
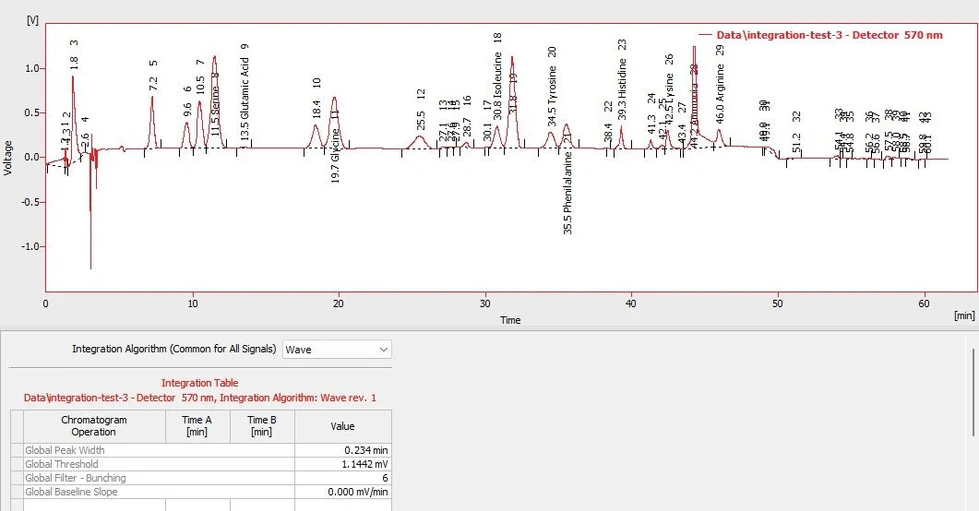 DataApex: Integration Algorithms in Clarity: Figure 2. Integration by Wave IA with the same parameters.
Shifting signal/baseline
Similar to the negative peaks/spikes, the same situation may arise with a shifting baseline where the peaks should be evaluated to that baseline. Legacy IA will provide unsatisfactory integration. In Legacy, this could be solved by applying Baseline Valley to several places and combining them with Integration Interval.
 DataApex: Integration Algorithms in Clarity: Figure 3. Integration by Legacy IA.
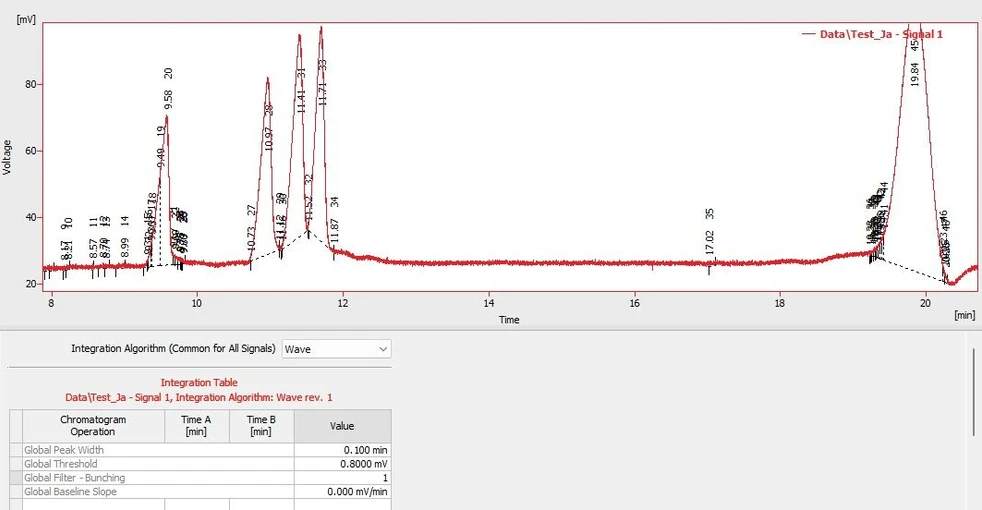
 DataApex: Integration Algorithms in Clarity: Figure 4. Integration by Wave IA with the same parameters. The fairly high number of peaks is caused by the low value of the Global Threshold.
Unresolved Peaks
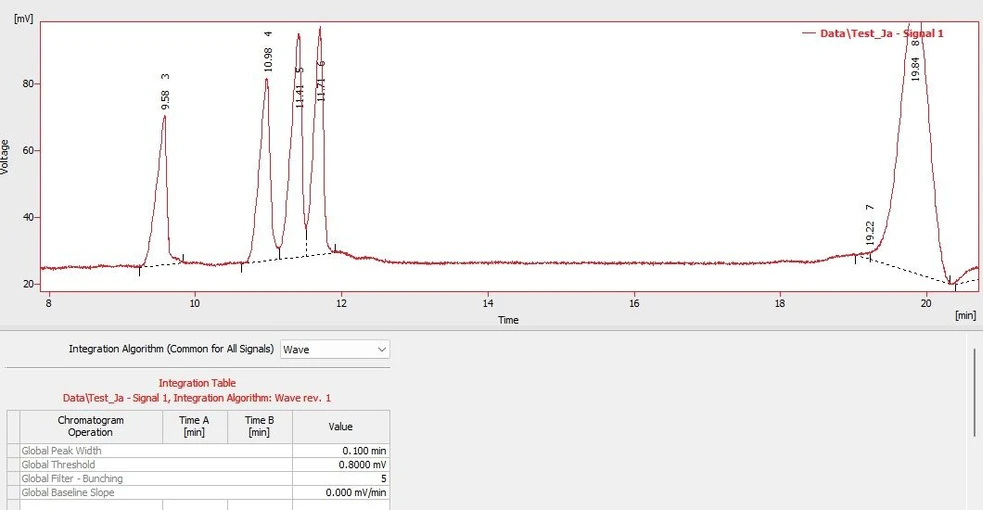
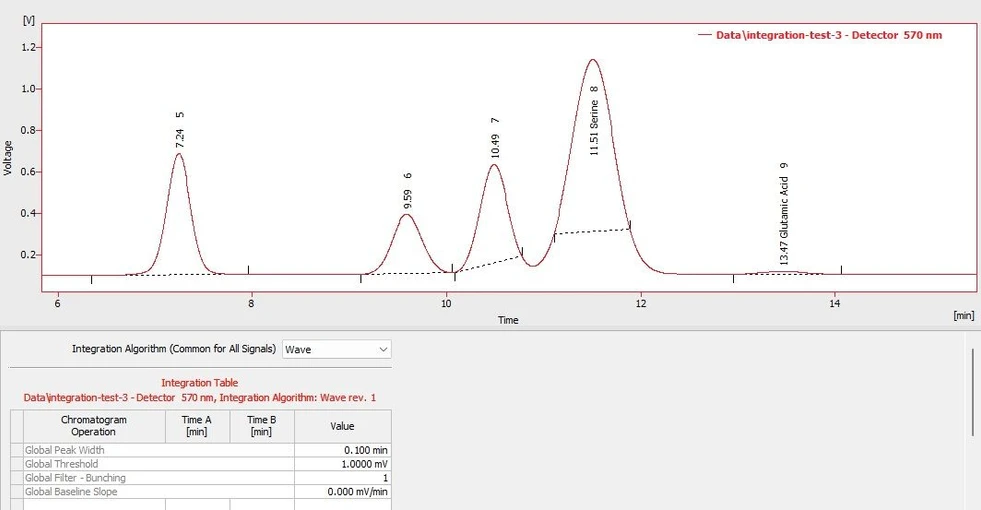
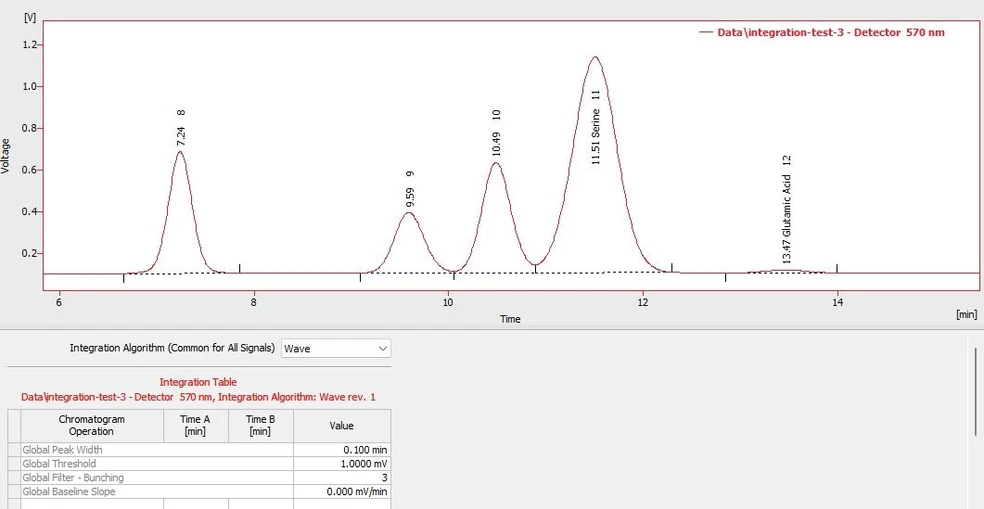
In Legacy IA, if a peak does not fulfill some criteria (it is too narrow or the valley to other non-resolved peaks is too low), it gets joined to a neighboring bigger peak. Meanwhile, Wave IA evaluates the valley depths much better and separates the peaks automatically, even when the small peak does not fulfill some of the criteria. Small impurities, thus, do not influence the area of the bigger peak of interest.
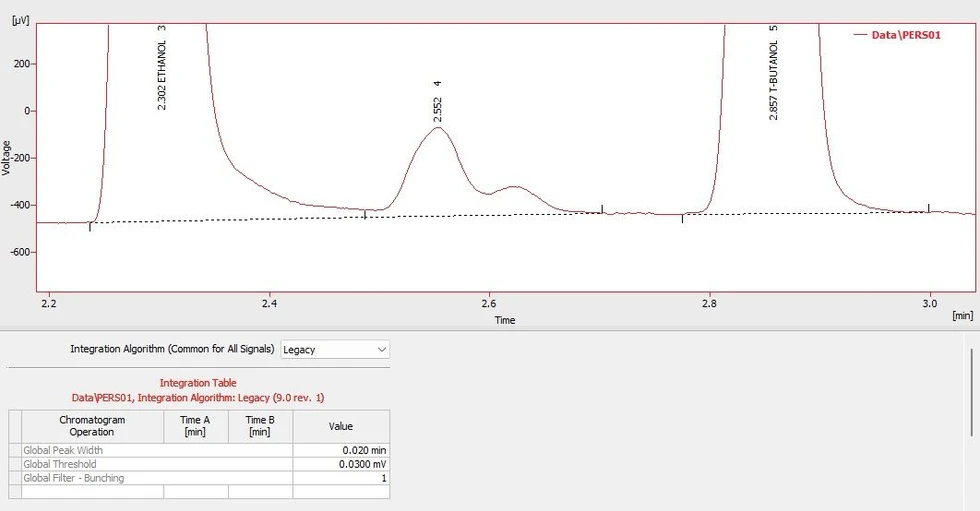 DataApex: Integration Algorithms in Clarity: Figure 5. Integration by Legacy IA.
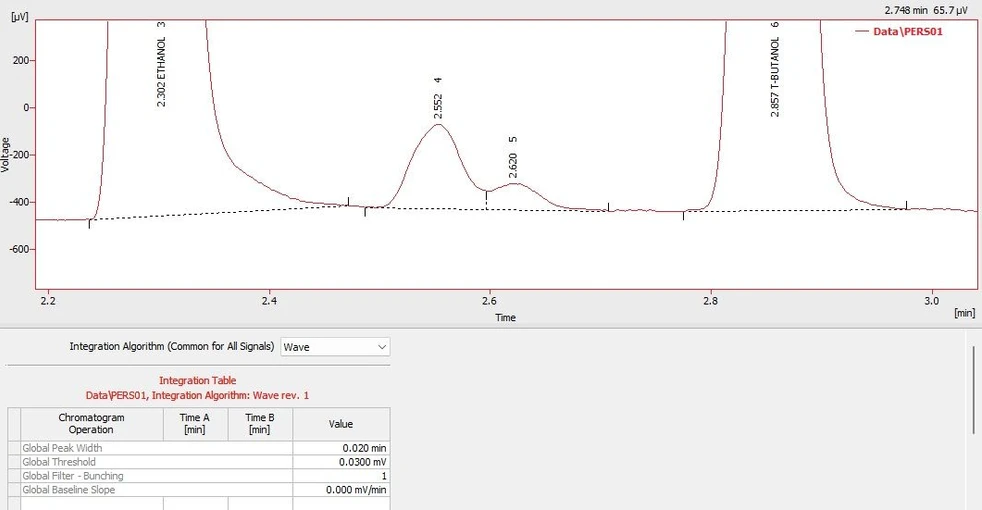 DataApex: Integration Algorithms in Clarity: Figure 6. Integration by Wave IA with the same parameters.
Significant noise
In some cases, the signal noise may be very significant, and the set threshold value in the Wave algorithm will be so low that one peak will be split into several peaks. The example below shows that neither of the IAs is sufficient with just Global Peak Width and Global Threshold; additional operations must be used.
 DataApex: Integration Algorithms in Clarity: Figure 7. Integration by Legacy IA with the same parameters.
 DataApex: Integration Algorithms in Clarity: Figure 8. Integration by Wave IA.
 DataApex: Integration Algorithms in Clarity: Figure 9. Integration by Wave IA after applying Global Bunching. Sometimes, small peaks at the start/end of a bigger one may remain.
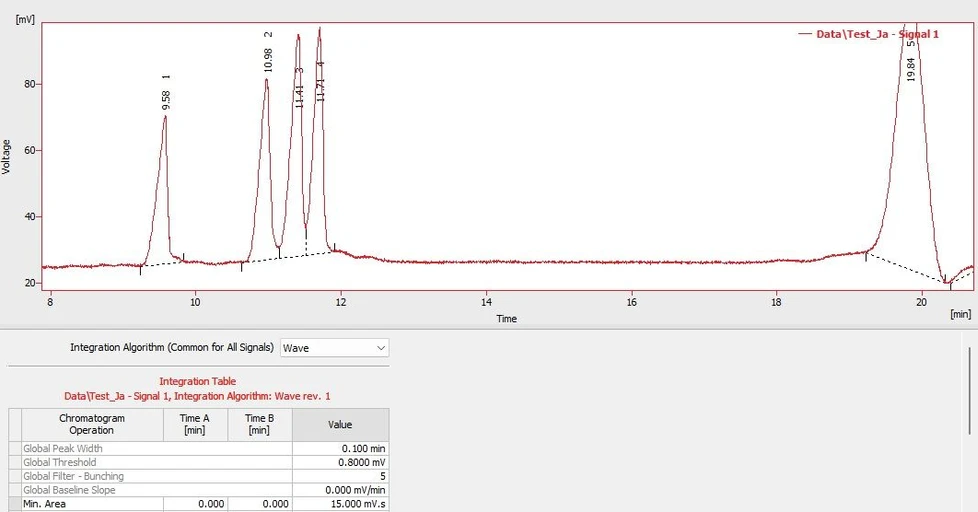 DataApex: Integration Algorithms in Clarity: Figure 10. Integration by Wave IA after applying Global Bunching and Minimal Area parameters.
Peaks with significantly different peak widths
Sometimes, chromatograms have very different peak widths; when some peaks cover a significant portion of the chromatogram (e.g., in EA or GPC), Wave IA may fail to evaluate the wide peaks properly. Currently, it is recommended to integrate these chromatograms using Legacy IA.
 DataApex: Integration Algorithms in Clarity: Figure 11. Integration by Legacy IA with the same parameters.
 DataApex: Integration Algorithms in Clarity: Figure 12. Integration by Wave IA.
Peaks cut off in the middle
Sometimes, random peaks get integrated strangely in Wave IA, being cut off. This happens only randomly in the Wave IA (in a series of chromatograms, most peaks are OK, but occasional chromatograms may have one or more peaks cut off). The phenomenon results from filtering the data in combination with the signal curve course. There is no 100% solution in the Wave algorithm (applying Global Bunching or other filters helps in most cases). Switching to Legacy IA helps.
 DataApex: Integration Algorithms in Clarity: Figure 13. Integration by Wave IA.
 DataApex: Integration Algorithms in Clarity: Figure 14. Integration by Wave IA after applying Global Bunching.
Basic integration workflow
Setting at least the Integration Interval and global parameters before resorting to other operations is recommended. This strategy suffices for most chromatograms, and such integration is then applicable to all similar samples. The recommended order of operations is as follows (refer to the User Guide for a detailed description):
- Set Integration Interval(s)
Some areas of the chromatograms are irrelevant to the analysis and may cause wrong integration of the rest of the chromatogram if left in operation, e.g., sudden steep signal rises/drops when lamps are switched on, mobile phase compositions suddenly changing, etc. Make sure that the Integration Interval operation does not define an interval starting or ending inside of a peak slope; in either IA, the expectation is that the chromatogram starts and ends on a baseline. - Set Global Peak Width
If the chromatogram has peaks with significantly differing peak widths, applying the Local Peak Width operation may be useful later. - Use Global Bunching operation
Global Bunching is calculated based on the chromatogram frequency and the set Global Peak Width, so it should be applied after setting the Global Peak Width. - Set Global Threshold
Based on the Threshold value, the smallest peaks are omitted depending on the noise of the signal curve. Since Global Bunching acts as a signal filter, the automatically suggested Global Threshold value will differ after applying Global Bunching higher than 1.
Exclusive features in Wave IA
Wave IA contains some Integration Table functions that are unavailable in Legacy IA. If these functions are present in the Integration Table, they will become invisible (not performed) when switching to the Legacy IA but will remain if the algorithm reverts to Wave.
Peak – Show and Peak – Hide
The Peak – Show and Peak – Hide functions provide a convenient way to manage the visibility of specific peaks in your data. These tools allow you to tailor your display by either showing or hiding specific peaks.
By default, the Wave algorithm might automatically ignore some of the minor peaks identified during integration. However, completely eliminating these peaks could potentially affect the baseline's trajectory. Therefore, these functions offer a flexible way to handle unwanted peaks without completely removing them.
Both the Peak – Show and Peak – Hide features are complemented by the Baseline – Lock function. This tool completely removes all peaks that have their maxima within a set time interval. This could affect other peaks with maxima outside the specified window, particularly if they share the same baseline.
The Peak – Hide function has been designed within the Wave algorithm to address this. It merely hides peaks within the selected time interval instead of eradicating them. These peaks are considered when constructing a joint baseline but excluded from the final calculation and the Result Table. The counterpart function Peak - Show allows you to visualize a previously hidden peak or display peaks automatically hidden by the algorithm.
In scenarios where a region of the chromatogram contains hidden peaks and the user executes the Peak – Add Positive/Negative operation, all automatically generated but concealed peaks within the defined time interval are replaced by the newly added peak. This could lead to the cancellation of hidden peaks in areas where the manually added peak is not displayed due to baseline crossing limitations.
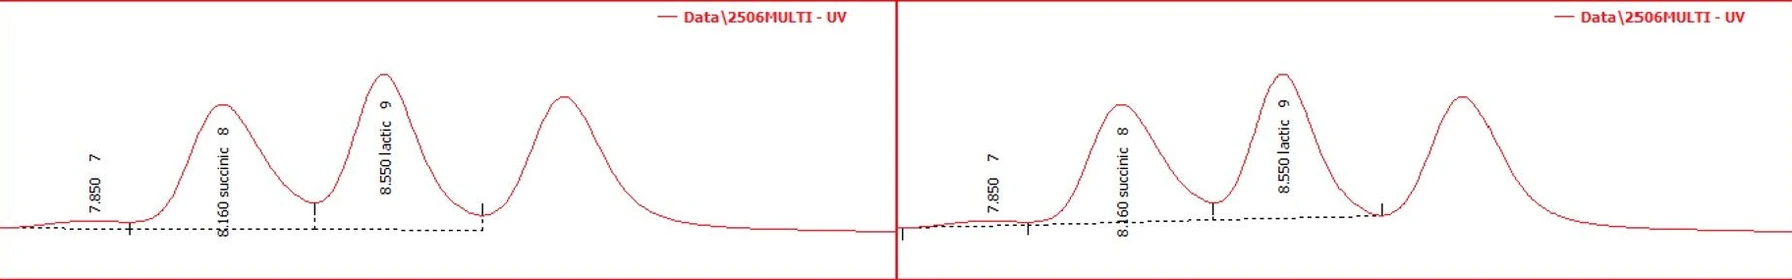 DataApex: Integration Algorithms in Clarity: Figure 15. Difference between Peak Hide (left) and Baseline Lock (right).
Global/Local Baseline Slope
Automatic peak generation on a standard signal curve typically comprises three parts: Peak Start, Peak Apex, and Peak End. The highest signal point determines the location of Peak Apex. At the same time, the positioning of Peak Starts and Peak Ends can vary, potentially being either closer or farther from the Peak Apex, based on user preference. Different settings can be more effective depending on the situation.
Before the introduction of the Wave IA, the automatic determination of Peak Starts and Peak Ends was governed by the instantaneous peak slope, calculated using the Global/Local Threshold parameter. If users wanted the automatically generated peak borders closer to the Peak Apex, they had to increase the Threshold value. However, this resulted in raising the detection limit for peaks on the baseline, which could prevent the identification of smaller peaks.
Wave IA presents an alternative. It allows users to maintain their chosen Threshold value while separately defining the chromatographic curve slope for detecting Peak Starts and Peak Ends through the use of the Global Baseline Slope or Local Baseline Slope operations. This parameter is not mandatory; users can retain the original slope calculation method by leaving the Global Baseline Slope value set to 0. Any value other than zero will cause a shift in the positions of the Peak Starts and Peak Ends.
You can find an approximate value for this function using the Chromatogram – Show Slope/Level function in the Chromatogram window menu. However, altering the Baseline Slope value may result in separating peak clusters into individual peaks or merging separate peaks, and some peaks may not be integrated at all.
For specific alterations to the start and/or end positions of individual peaks, the Peak – Start and Peak – End operations remain useful. These functions override the automatically calculated positions for peak start and peak end.

-4_s.webp)