News from LabRulezGCMS Library - Week 19, 2025

LabRulez: News from LabRulezGCMS Library - Week 19, 2025
Our Library never stops expanding. What are the most recent contributions to LabRulezGCMS Library in the week of 5th May 2025? Check out new documents from the field of the gas phase, especially GC and GC/MS techniques!
👉 SEARCH THE LARGEST REPOSITORY OF DOCUMENTS ABOUT GCMS AND RELATED TECHNIQUES
👉 Need info about different analytical techniques? Peek into LabRulezLCMS or LabRulezICPMS libraries.
This week we bring you application notes by Agilent Technologies, Shimadzu and Thermo Fisher Scientific and poster by MDCW!
1. Agilent Technologies: Ultrafast Total Petroleum Hydrocarbon Analysis by the Agilent 8850 GC with FID
- Application note
- Full PDF for download
TPHs refer to a broad family of hydrocarbons found in crude oil or its refined products such as gasoline, diesel, and lubricating oils. Petroleum hydrocarbons are present in the environment due to industrial activities, spills, or natural occurrences. Soil and drinking water can become contaminated with TPHs, with soil contamination reducing the usability of land development. TPH analysis can be used to analyze the hydrocarbons in soil, water, and sediment samples. This testing is an essential component of risk assessment and management when the soil and water resource needs development.
Gas chromatography (GC) is the most common technique for the quantitative analysis of TPH in water, soil, and sediment. ISO 167031 and China HJ 1021-20192 standard methods describe the measurement of TPH in soil and sediment using GC with FID (GC-FID). HJ 894-20173 describes TPH analysis in water samples by GC-FID. In these methods, the 10 to 30 m columns coated with nonpolar stationary phases such as Agilent J&W DB-1, DB-5, and HP-5 are often recommended for separation. The typical oven ramp rate used is 20 to 40 °C/min, and the column flow rate is between 1.5 and 3 mL/min. The GC separation takes 15 to 40 minutes to complete. The quantitation of TPHs is performed by integrating the area between the n-decane (n-C10 ) and n-tetracontane (n-C40 ) peaks, then calculating the corresponding TPH concentration based on the external calibration curve developed from n-alkanes calibration standards (HJ methods) or mineral oil calibration standards (ISO 16703). In HJ 1021 and HJ 894 methods, the integration retention time (RT) window of TPH extracts starts right before the n-C10 peak and ends after the n-C40 peak, by referring to their corresponding RTs obtained from the n-alkanes calibration standard. In the ISO 16703 method, the calibration standards are mineral oils of known concentrations instead of n-alkanes. The n-C10 and n-C40 should be added to mineral oil calibrants and TPH extracts as RT window indicators for integration. The n-C10 and n-C40 are not included in the TPH integration.
In this application note, a fast TPH analysis method was implemented and verified on the 8850 GC. System performance was assessed according to ISO 16703, HJ 1021‑2019, and HJ 894-2017 requirements. It also demonstrates the use of peak evaluation to automatically evaluate n-C40 recovery rate.
Results and discussion
Analysis speed
Ultrafast analysis using the 8850 GC is possible due to its compact GC oven with low thermal mass, optimized oven fan, and air duct. These features help shorten oven heating and cooldown time, effectively increasing the separation speed. The oven temperature ramp rate used in this work can be achieved on the 8850 GC (200 to 240 V) fast oven option. A single analytical cycle takes approximately 8.5 minutes, including 1 minute of oven initial equilibrium, 3 minutes of separation (n-C40 eluted within 2.5 minutes), 2 minutes of post-run to remove the sample matrix from the column, and 2.5 minutes of oven cooldown (22 °C ambient). Among them, the post-run time can be adjusted according to sample matrix complexity. For the 8850 GC 120 V option, the oven ramp rates are slower than the 200 to 240 V option. The chromatogram of n-alkanes separation using the 120 V fast oven ramp rate is shown in the Appendix. The retention time of n-C40 increased from 2.4 to 3.0 minutes, which is still fast and enables an analysis cycle of approximately 9 minutes.
Real sample analysis
TPH extracts from water and soil samples (both chromatograms are shown in Figure 6) were analyzed using the ultrafast method. The TPH in water sample was measured at 703 mg/L (corresponding to 70.3 mg/kg in the real sample). The TPH in soil extract was estimated to be 21,575.6 mg/L (approximately 2,157.5 mg/kg), which exceeded the calibration range. Under normal circumstances, a dilution for re-analysis or re-extraction on a lower amount of sample would be needed if an accurate quantitation is required for a highly contaminated sample. However, in this study, reanalysis was not performed; instead, the repeatability of the test results was demonstrated at different concentrations. As shown in Table 4, the quantitation precision of real samples (quantitation followed HJ methods) was consistent with the above-mentioned precision performance based on the n-alkanes and mineral oil standards.
Conclusion
This application note demonstrates an ultrafast TPH analysis on an Agilent 8850 GC. The system performance using He carrier gas was verified according to ISO 16703, HJ 1021-2019, and HJ 894-2017 methods, including resolution, system suitability, repeatability, linearity and carryover. The system demonstrated excellent performance in all of these areas. Also demonstrated is an ultrafast analysis using H2 carrier gas. The H2 method showed equivalent performance in terms of n-C40/n-C20 recovery, linearity range, and RT/response precision. The peak evaluation function of the 8850 GC is demonstrated in the application of autonomous system suitability verification, which can help effectively track GC inlet performance and indicate when maintenance is needed. Overall, this application note demonstrates that an Agilent 8850 GC can generate reliable TPH analysis results and significantly improve lab productivity in an intelligent way.
2. MDCW: Aroma Profiling of Commercial Poi Products in Fresh and Aged States Using Comprehensive Two-Dimensional Gas Chromatography
- Poster
- Full PDF for download
Taro (Colocasia esculenta L.) is a tropical root from southeast Asia now found in tropical and subtropical regions around the world. Poi is a food product prepared from steamed taro that has been macerated and allowed to ferment. Investigating the profile of poi via GC×GC-qMS can enhance understanding of its unique qualities, historical context, and contemporary uses.
Volatile organic compounds (VOCs) produced during fermentation have traditionally been detected through gas chromatography-mass spectrometry (GC-MS).
Aim: observe changes in fresh to aged commercially purchased poi using comprehensive two-dimensional gas chromatography-quadrupole mass spectrometry with flame ionization detection (GC×GC-qMS), demonstrated to be a more effective tool in identifying the VOCs produced by fermentation1,2,3 .
Specifically, the three goals of the project were to:
- establish the core VOC profile of poi
- establish differences in commercial products
- establish VOC changes that occur during fermentation.
Method
Sample Preparation:
- Poi samples were prepared according to respective package instructions
- 5 g of poi was transferred into labelled 20 mL SPME headspace vials and analyzed on the GC×GC-qMS/FID immediately (fresh) and seven days after preparation (aged)
- Solid Phase Microextraction Arrow (SPME Arrow) sampling with a 1.50 mm wide sleeve divinylbenzene/carbon wide range (CWR) fiber was used
Quadrupole mass spectrometry data (albeit slower than time-of-flight) has been previously shown to be capable of sufficient data rate for integration4 . The qMS data was analyzed using mass spectral data for peak integration though AnalyzerPro XD (Spectralworks Ltd.):
- Samples were input using group classes
- Taro (Taro)
- Hanalei (HA)
- He Mea Ono (HMO)
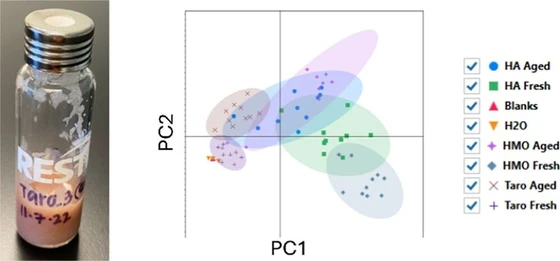
- Data was visualized with principal component analysis (PCA) plots, box plots, and volcano plots
- Could “toggle” class comparisons by selecting/deselecting categories to answer different research questions
- Groups included: Hanalei (HA) aged and fresh, He Mea One (HMO) aged and fresh, Taro aged and fresh, Water, and Blanks.
- A threshold of 30% detection within class was used, leaving only compounds on the list which appeared in greater than 30% of the samples within each group.
Conclusion
Goal 1: Establish core VOC profile of poi
- 56 compounds identified across all samples
- 14 compounds present in fresh samples only and 18 compounds present in aged samples only
- 24 core compounds found across all brands
Goal 2: Establish differences in VOC profiles of commercial products
- Each product had a unique set of 2-8 compounds that were not present in other products
Goal 3: Establish changes that occur during fermentation of poi products
- Presence of 1-pentanol, acetic acid, and 2,5-dimethylfuran indicated fermentation
- Each brand also had unique markers to its fermentation process
3. Shimadzu: Analysis of Carbonate Esters, Additives, and Phosphate Esters in Lithium-Ion Battery Electrolyte Using GCMS-QP2050
- Application note
- Full PDF for download
User Benefits:
- The integration of GCMS-QP2050 and GC-2050 enables high-precision analysis of compounds in electrolytes while optimizing space utilization.
- The mass spectrometer enables the identification of unknown components.
In recent years, lithium-ion batteries have rapidly gained traction in fields, including electric vehicles and portable electronic devices, owing to high energy density and long lifespan. This widespread adoption is largely driven by increasing demand for sustainable energy solutions and advancements in technology. The performance of lithium-ion batteries is significantly influenced by the composition and purity of carbonate esters and additives in the electrolyte, as well as by impurities introduced during manufacturing or formed during storage. Therefore, qualitative and quantitative analysis of these components is critically important.
In a previous publication1), quantitative analysis of carbonate esters and additives in electrolytes was demonstrated using the Brevis GC-2050 + FID. In this report, equivalent quantitative analyses were conducted using the GCMS-QP2050 (Fig. 1), and additional qualitative examinations of impurities were performed. GCMS-QP2050, with its high analytical performance and spacesaving design, contributes to highly precise analyses. Furthermore, combining it with AOCTM-30i auto-injector delivers enhanced accuracy, improved analytical stability, and increased productivity.
Qualitative Analysis of Impurities in LiPF₆-Based Electrolytes using Low Ionization Energy (LEI)
Qualitative analysis was performed on an unknown component in the LiPF₆-based electrolyte indicated by the arrows in Fig. 4 using simultaneous Scan/SIM analysis (FASST) (Scan Event Time: 0.3 s, Scan m/z Range: 35–500).
Use of LiPF₆ as an electrolyte can lead to the formation of volatile phosphate esters, particularly at elevated operating voltages or over extended run times. Dimethyl fluorophosphate (DMFP), which has a molecular ion at m/z 128 and a principal fragment ion at m/z 98, is one of the phosphate esters2). Although DMFP is not registered in the mass spectral library used in this study, qualitative analysis was conducted using information on the molecular ion, which is critically important for identification. However, in the mass spectrum acquired in Scan mode, the signal intensity for the molecular ion at m/z 128 was weaker than that of the fragment ions (upper part of Fig. 6, arrow).
To enhance detection of the molecular ion peak, a low-electronionization-energy (LEI) technique was employed. Specifically, the ionization voltage was lowered from 70 V (the standard EI setting) to 14 V. Under these conditions, the signal intensity for the molecular ion at m/z 128 increased by approximately fourfold (Fig. 6, bottom, arrow).
Based on prior investigations, the four-fold increase in the m/z 128 molecular ion signal in LEI, and the absence of this peak in the LiFSI-based electrolyte, the impurity was inferred to be DMFP. Notably, under standard qualitative workflows, mass spectral library searches and comparison of retention times against reference standards afford straightforward identification of unknown peaks.
Conclusion
In this study, eight commonly used carbonate esters and additives in lithium-ion battery electrolytes were quantified using the GCMS-QP2050. The standard mixture exhibited chromatographic separation, and the calibration curve indicated excellent linearity. Analysis of four commercial electrolyte samples detected and quantified multiple carbonate esters. Additionally, impurities were detected in these samples. By applying low-electron-ionization (LEI) to strengthen the molecular ion signal, the impurity was identified as DMFP.
4. Thermo Fisher Scientific: Streamlining environmental monitoring: Advanced analysis of PBDEs using triple quadrupole GC-MS/MS
- Application note
- Full PDF for download
Goal
- To enhance the efficiency of environmental laboratories by implementing a unified configuration that addresses all regulatory requirements for PBDEs in environmental analysis worldwide.
- Thermo Fisher Scientific presented a new analytical approach using a single column to streamline laboratory operations with a unified configuration in Application Brief 002866.
- This application brief outlines how the proposed GC-MS/MS configuration can effectively analyze PBDEs, ensuring compliance with regulatory standards such as the European Standard 16694:2025.
Polybrominated diphenyl ethers (PBDEs) are a class of brominated hydrocarbons commonly used as additive flame retardants in various materials. These compounds can leach into the environment, where they persist and bioaccumulate, posing potential risks to human health and ecosystems. Structurally, PBDEs consist of two phenyl rings linked by an oxygen atom. The environmental analysis of PBDEs, as outlined in the European Standard 16694:2025, necessitates the determination of specific congeners such as BDE-28, -47, -99, -100, -153, and -154.
Advanced laboratory techniques, such as the use of triple quadrupole GC-MS/MS systems, have been developed to efficiently analyze these compounds. These systems offer high selectivity and sensitivity, enabling the accurate detection and quantification of PBDEs alongside other environmental contaminants like pesticides and micropollutants. Implementing a single GC-MS/MS configuration can streamline laboratory processes, enhancing productivity and reducing operational costs by consolidating multiple analytical methods into one robust system.
This application brief describes an analytical method for the trace analysis of PBDEs with the Thermo Scientific™ TraceGOLD™ TG-Contaminants GC column and the Thermo Scientific™ TSQ™ 9610 Triple Quadrupole GC-MS/MS System equipped with Advance electron ionization (AEI) source. This method complies with all the expectations of laboratories—precision, sensitivity, reliability, and robustness.
Results and discussion
Sensitivity
The chromatograms in Figures 5–8 illustrate examples of six PBDEs at the LOQ in solvent, showcasing excellent resolution, peak shape, and signal-to-noise ratio. The sensitivity of the analytical method demonstrates its capability to detect all compounds at very low levels, ensuring precise and reliable measurements.
All target congeners were successfully separated in under 17 minutes, achieving excellent resolution of the critical pair PBDE 49 and PBDE 71 (Figure 5). The use of the TraceGOLD TG-Contaminants capillary column ensured good chromatographic peak shapes for all compounds, including PBDE 209 and DBDPE, which are particularly difficult to analyze due to their tendency to break down and exhibit peak tailing.
Conclusion
The developed analytical method combined with the unique features of the TSQ 9610 GC-MS/MS allow for method consolidation on a single platform while ensuring compliance with current regulations:
- Single configuration for efficiency: Thermo Fisher Scientific's analytical approach using a single column and triple quadrupole GC-MS/MS (TSQ 9610 system) streamlines the analysis of PBDEs, ensuring compliance with global regulatory standards such as European Standard 16694:2025.
- Comprehensive analysis capability: The TraceGOLD TG-Contaminants column provided exceptional chromatographic peak shapes and resolution, even for challenging compounds like PBDE 209 and DBDPE, ensuring precise and reliable measurements at very low levels (LOQ) for multiple PBDE congeners, with relative amount deviations consistently meeting stringent acceptance criteria, all within 17 minutes run time.
- Exceeding regulatory requirements for PBDEs: The method achieved LOQs surpassing those required by regulations.
- Linearity and sensitivity validation: The system demonstrated excellent linearity (R² > 0.990) and low limits of quantification.
The possibility of applying the same analytical method on a single analytical platform, without the need to change configuration and consumables, would allow contract testing laboratories to improve productivity, reduce the costs of ownership, and expand the list of analytes for future-proof performance.