New strategies for non-targeted quantification in comprehensive two-dimensional gas chromatography: The potential of reconstructed TIC response factor surfaces
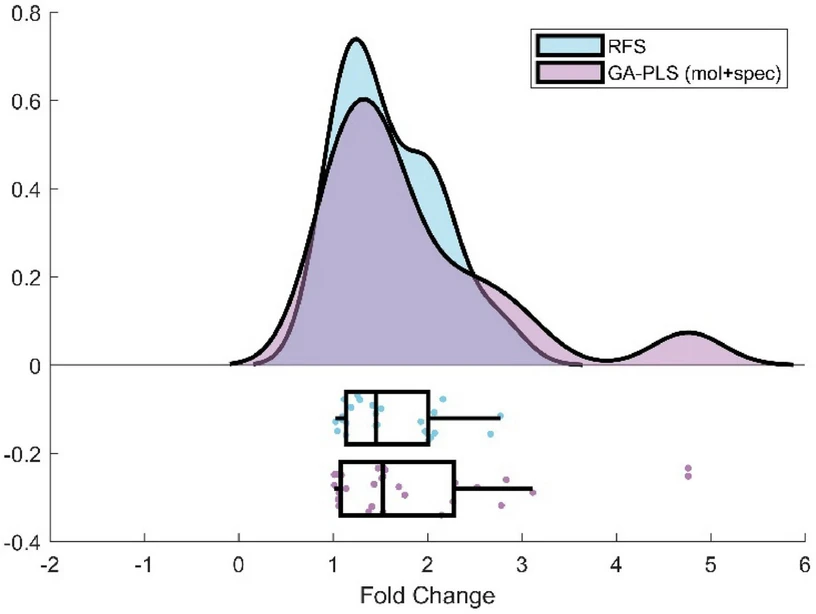
Journal of Chromatography A, Volume 1747, 26 April 2025, 465811: Fig. 7. Rainfall plots illustrating fold change error of Re-TIC RFS and GA-PLS (mol+spec) approaches.
The goal of this study is to develop and evaluate a novel approach for estimating compound concentrations in complex environmental samples using comprehensive two-dimensional gas chromatography (GC×GC). The method involves reconstructing total ion current (TIC) response factor surfaces (RFS), which link retention time coordinates to response factors, enabling quantification without the need for authentic standards.
By applying this approach to 27 compounds in both solvent and wastewater effluent matrices, and comparing it with traditional RF prediction models based on molecular descriptors, the study demonstrates that the RFS method achieves comparable accuracy. This approach supports both suspect screening and non-targeted analysis, offering a powerful tool for realistic concentration estimates without requiring compound identification or molecular information.
The original article
New strategies for non-targeted quantification in comprehensive two-dimensional gas chromatography: The potential of reconstructed TIC response factor surfaces
Jason Devers, David I. Pattison, Asger B. Hansen, Jan H. Christensen
Journal of Chromatography A, Volume 1747, 26 April 2025, 465811
https://doi.org/10.1016/j.chroma.2025.465811
licensed under CC-BY 4.0
Selected sections from the article follow. Formats and hyperlinks were adapted from the original.
The thermal conductivity detector (TCD)[1] and flame ionization detector (FID)[2,3] represent two of the first detectors developed and employed in gas chromatography (GC), both during the mid-late 1950s. In the years following the creation and adoption of these two detectors, numerous approaches were developed that allowed for the response factor (RF, the ratio between a compound's detector response and its concentration) of compounds of interest to be determined. This was achieved experimentally[4,5], as well as predicted based on molecular descriptors in the case of FID, using the effective carbon number (ECN) approach, where the RF is proportional to the amount of carbon within the compound [6]. These reference RFs were then used to determine compound concentrations without the need for specific standards, proving to be a valuable tool for semi-quantitative analysis and offering a distinct advantage in the use of these detectors. For both detectors, lower RFs for more polar compounds were observed, e.g., alcohols and acids, compared to non-polar compounds [4]. The ECN approach has also been applied to the electron ionization mass spectrometer (EI-MS), showing a correlation between the total ion current (TIC) RF and ECN for sets of volatile organic compounds [[7], [8], [9]].
Recently, quantitative structure-property relationship (QSPR) models have allowed for the prediction of RFs in GC; these models rely on mathematically and experimentally derived molecular descriptors to model and predict RF. QSPR approaches were initially applied to data acquired with an FID[10,11] and later to mass spectrometry (MS) detector [[12], [13], [14]]. QSPR models remain a popular means of determining RFs in GC–MS, incorporating molecular descriptors such as molecular weight, logP, polar surface area and fractional ion abundance (most abundant ion in the spectra as a fraction of the total abundance of all ions in the spectra), analogous to the total ion current (TIC) spectra [15,16]. Use of fractional ion abundance can be more selective than using the TIC response, which may be influenced by baseline signals and coeluting compounds in complex samples, however, the ability to choose a specific, more selective ion would be useful in future strategies. However, when applied to MS, these methods show weaker correlations between experimental and predicted RFs compared to TCD and FID [17]. The more accurate modeling of RFs using TCD and FID is likely resultant from the fact that their response can be largely modelled using a single variable, e.g. the amount of carbon combusted in the FID [18]. Additionally, as with RFs determined using TCD and FID, GC–MS methods tend to yield lower RFs for polar compounds compared to those that are non-polar, with polar surface area, percentage of oxygen atoms and LogP shown to be negatively correlated with response factors [14,16].
Comprehensive two-dimensional gas chromatography (GC × GC), developed by Liu and Phillips in 1991, allows for the separation of complex mixtures via two discreet separation mechanisms/columns [22]. Typically, a non-polar column is used in the first dimension, followed by a more polar column in the second [23]. This allows for separation in the first dimension primarily based on boiling-point, while the second dimension separates compounds based on polar interactions. The increased separation power and peak capacity of GC × GC have made it a powerful tool for targeted, suspect screening, and non-targeted analysis of highly complex samples, such as wastewater [24,25]. The orthogonal separation capabilities of GC × GC, combined with the tendency of RFs to decrease for more polar compounds in GC–MS (likely due to interactions with active sites in the liner and GC column[26,27] as well as mass discrimination effects[28]) provides a unique opportunity for estimating RF values. We hypothesize that separating compounds in two-dimensional space using GC × GC can be used to predict TIC RF variability across different compounds. By employing this relationship, it should be possible to estimate a compound's RF based on its position within the 2D separational space, enabling the estimation of analyte concentrations without the need for reference standards. This is particularly relevant for environmental samples such as wastewater, as it enables the assessment of the impact of compounds of interest on both environmental and human health. Furthermore, reference standards of emerging contaminants and transformation products are often unavailable for purchase [29].
In this study, we investigate the dependence of a compound's TIC RF based on its position in the GC × GC separation space. A 2D response factor surface (RFS) is plotted for a set of 83 training set compounds, where the X, Y, and Z coordinates correspond to the 1D, and 2D retention times and RFs (in terms of TIC) for each compound. This allows the concentration of analytes of interest to be estimated without the need for matching standards.
Approaches are outlined for both suspect screening and non-targeted analysis, depending on the availability of reference spectra. The RFS approach is then validated using an independent set of 27 uncalibrated compounds. The same compound set is also used to develop predictive models using genetic algorithm-based feature selection and partial least squares regression (GA-PLS) models, incorporating molecular descriptors, retention times, and mass spectra. The accuracy and precision of both methods has been validated and compared using the independent validation set of 27 uncalibrated compounds.
3. Materials and methods
GC × GC-QTOF-MS Analysis. Analysis was carried out using an Agilent 7890B GC system coupled to an Agilent 7200 Accurate Mass QTOF mass spectrometer with an EI source (Agilent Technologies, Palo Alto, CA, USA). Two-dimensional separation was achieved using a secondary column oven paired with a Zoex ZX2 cryogen-free modulator (Zoex Corporation, Houston, TX, USA). The first dimension separation was carried out using a Rxi-5Sil MS column (60 m, 0.25 mm i.d., 0.25 μm film thickness), while the second dimension column was a mid-polar Rxi-17Sil MS (1.5 m, 0.18 mm i.d., 0.18 μm film thickness) from Restek (Bellefonte, Pennsylvania, U.S.A). A 0.7 m section of the same Rxi-5Sil MS column as used in the first dimension was used for the modulation loop, and all sections were connected with SilTite μ-union ferrules (SGE Analytical Science, Wetherill Park, Australia).
Data analysis. Instrument data acquisition was performed using Mass Hunter (Agilent, version: B.07.02.1938), and interpretation of the GC × GC–MS chromatograms was done with GC Image (GC Image LLC, version: 2.9R1.1). A template was created to define integration volumes for each analyte of interest, including qualifying and quantifying ions. After phase and baseline correction, the template was applied to each chromatogram. The resulting blob tables with relevant TIC and individual ion responses, were exported as .csv for further processing in Microsoft Excel (Version 2105).
4. Results/discussion
4.1. Generation and application of TIC RFS to validation set
As detailed in TIC workflow 1 (Fig. 1), plotting the determined TIC RFs of each compound in solvent as a function of its 1D and 2D retention time and using a planar RFS fit (1st degree polynomial in both 1D and 2D) resulted in an RFS with a low correlation coefficient (R2 = 0.2435) and a p value of 0.107 via one-way ANOVA analysis in OriginLab. Since the p-value, exceeds 0.05, the RF fit is not significantly better than using a single RF value for all compounds.
Generation of Reconstructed TIC RFS and Application to Validation Set. As outlined in reconstructed TIC workflow 2, steps 2.1 through 2.7 (Fig. 1), a reconstructed TIC RFS was generated using the training set compounds. The resulting RFS, shown in Fig. 3(a), is described by the function: f(x,y) = −101.4 + 117.3x + 1417.3y. This approach, applied to the calibrant compounds, yielded an improved R2 of 0.3549 compared to the initial TIC method, with a p-value of 0.0306 from a one-way ANOVA, showing a weak correlation between the three variables.
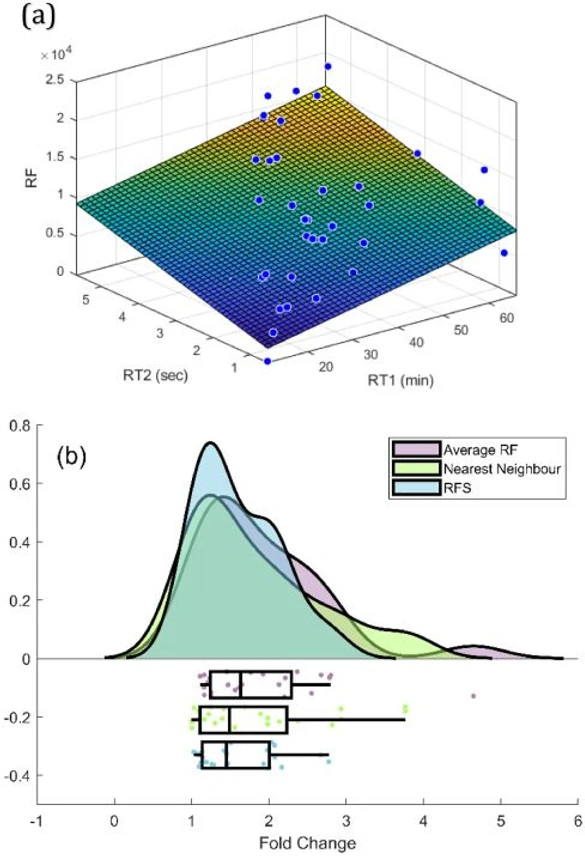 Journal of Chromatography A, Volume 1747, 26 April 2025, 465811: Fig. 3. (a) 2D TIC RFS generated by fitting calibrant 1D retention times (X-axis), 2D retention times (Y-axis), and RFs (Z-axis) using a planar surface fit in Matlab. (b) Rainfall plot showing prediction error for the validation set compounds (n = 27) using the RFS from (a), compared with nearest-neighbour and average RF approaches.
To determine the optimal surface fit, RFS were generated in MATLAB Curve Fitter using polynomial fits of varying degrees, both in 1D and 2D, as shown in Table 1., higher R2 values were observed for higher degree polynomial fits in the 2D, consistent with the non-linear elution patterns typically seen in 2D due to the increasing primary oven temperatures. This is supported by both isovolatility curve[34] and retention index surface approaches for 2D retention indices [30]. A small improvement in the fold-change distribution for the validation set compounds was also observed with higher-degree polynomial fits.
Generation and application of genetic algorithm – partial least squares regression (GA-PLS) RF Model. Modeling of RFs using molecular descriptors was first attempted using the AutoQSAR function within Schrödinger. However, this application operates as a black box, with no visibility of chosen variables, and no user input regarding training/validation set in creating the model.
To have more control over the modelling procedure, PaDEL was used to generate 1444 molecular descriptors for the training and validation set compounds. Following variable selection via genetic-algorithm, a partial least squares (PLS) regression model was created in Matlab, using PLS Toolbox (as detailed in supporting information). Three models were developed using either molecular descriptors (mol), or spectral data (spec), or a combination of both (mol + spec); in all three models 1D and 2D retention times were included for the compounds. The resulting R2 of calibration for the three models was 0.710, 0.869 and 0.784 respectively, as shown in Fig. 5 for the mol+spec model.
 Journal of Chromatography A, Volume 1747, 26 April 2025, 465811: Fig. 5. Measured vs. predicted RF for the model including both molecular descriptors and spectral data (mol+spec), R2 = 0.784.
Fig. 6 illustrates the prediction error for the validation set compounds using PaDEL molecular descriptors (mol), mass spectra (spec), and both combined (mol+spec). Whilst the model utilising spectra and retention times only (spec) yielded the highest R2 of calibration, significant errors were observed in prediction of the validation set compounds, with negative values for several RFs. The model using molecular descriptors, spectral data and retention times (mol + spec) yielded the narrowest distribution of fold change errors, as illustrated in Fig. 6 and Table 2. This model selected 63 molecular descriptors and 59 mass channels after GA, and with the addition of 1D and 2D retention times, resulted in an average fold change error of 1.76 (ranging from 1.01 to 4.76). Interestingly, 2D retention time was a selected variable in all models, reinforcing the utility of the RFS approach, and demonstrating that retention time accounts for some of the variance in the RF for a compound.
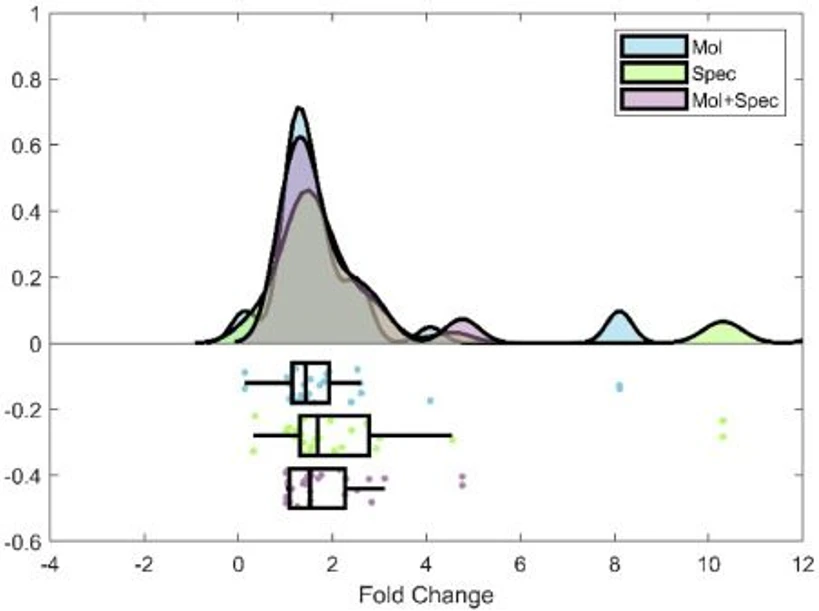 Journal of Chromatography A, Volume 1747, 26 April 2025, 465811: Fig. 6. Rainfall plots showing fold change error for GA-PLS approaches utilizing molecular descriptors (mol), spectral data (spec), and a combination of both molecular descriptors and spectral data (mol+spec).
5. Conclusion
This study demonstrates that reconstructed total ion current response factor surfaces (RFS) in comprehensive two-dimensional gas chromatography-mass spectrometry (GC × GC–MS) provide a reliable and innovative method for estimating the concentration of compounds in complex matrices without the need for relevant reference standards. The RFS approach achieved an average fold-change error of 1.55 for suspect-screening and 1.83 for non-targeted analysis, delivering accuracy comparable to or better than predictive modelling techniques, such as genetic algorithm-partial least squares regression (GA-PLS), which yielded an average fold-change error of 1.76. Notably, the matrix-specific RFS further improved accuracy, reducing the average fold-change error to 1.34, highlighting the importance of addressing matrix effects.
By enabling the quantification of both known and unknown compounds, the RFS methodology overcomes critical limitations in environmental analytical chemistry, particularly in scenarios where reference standards for emerging contaminants or transformation products are unavailable. This capability holds significant potential for enhancing regulatory assessments, environmental monitoring, and prioritization of unknown features in non-targeted workflows using GC × GC–MS. Overall, RFS establishes itself as a transformative tool for advancing both suspect and non-targeted screening analyses, offering a versatile and scalable solution for modern analytical challenges.


