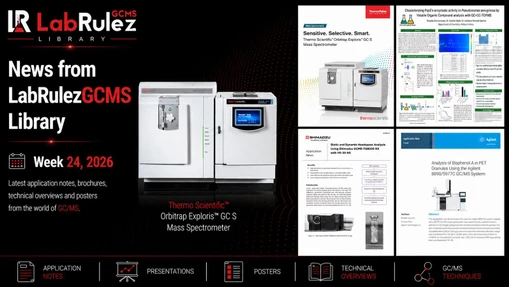
News from LabRulezGCMS Library - Week 7, 2025

LabRulez: News from LabRulezGCMS Library - Week 7, 2025
Our Library never stops expanding. What are the most recent contributions to LabRulezGCMS Library in the week of 10th February 2025? Check out new documents from the field of the gas phase, especially GC and GC/MS techniques!
👉 SEARCH THE LARGEST REPOSITORY OF DOCUMENTS ABOUT GCMS AND RELATED TECHNIQUES
👉 Need info about different analytical techniques? Peek into LabRulezLCMS or LabRulezICPMS libraries.
This week we bring you applications and other documents by Shimadzu, Agilent Technologies and Thermo Fisher Scientific!
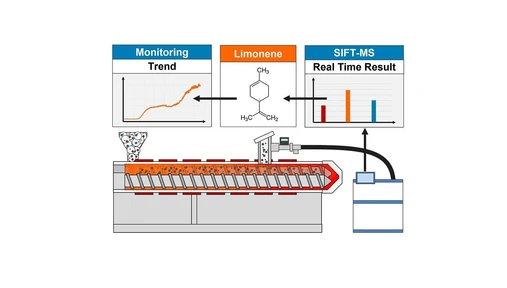
1. Agilent Technologies: Analysis of Aldehydes, Benzene, and Limonene in Recycled Polyethylene Terephthalate
Using an Agilent 7697 headspace sampler and 8890/5977C GC/MSD
- Application note
- Full PDF for download
PET is commonly used in the food and beverage industry, as it is easy to recycle. The quantity of food containers and beverage bottles made from recycled PET materials is on the rise.
Contaminants in recycled PET, including acetaldehyde, benzene, and limonene, can migrate from the packaging into the contents, potentially affecting the safety and quality of the products stored inside.1 Monitoring these contaminants is crucial for ensuring the quality of recycled PET products, as they can affect the physical, chemical, and sensory properties of recycled PET, potentially leading to product defects or health concerns.
This application note demonstrates the use of a 7697 headspace sampler and 8890/5977C GC/MSD for the analysis of acetaldehyde, benzene, and d-limonene in recycled PET materials. With the developed method, acetaldehyde, benzene, and d-limonene in three recycled PET samples were successfully quantified.
Conclusion
This application note describes the quantitative analysis of acetaldehyde, benzene, and d-limonene using an Agilent 8890/5977C GC/MSD with an Agilent 7697 headspace sampler. This method offers the advantages of full automation, rapid analysis, and minimum sample preparation. With this automated workflow solution, excellent sensitivity was demonstrated with an LOD of 0.034 ng/µL for acetaldehyde, 0.002 ng/µL for benzene, and 0.006 ng/µL for d-limonene. Good linearity was demonstrated, with R2 above 0.999 for all three compounds over wide concentration ranges. Three recycled PET samples were analyzed, with a detection of acetaldehyde from 474 to 975 μg/kg, benzene from 5.5 to 18.6 μg/kg, and d-limonene from 0.42 to 3.21 μg/kg.
2. Shimadzu: GC/MS Analysis of Fluorophosphates as Decomposition Products in Lithium Battery Electrolyte
- Application note
- Full PDF for download
User Benefits:
- A routine and fast GC/MS method for detection of LIB decomposition products.
- Monitoring of the LIB electrolyte after manufacturing, storage and transport.
- Fluorophosphates can be considered as markers for a started electrolyte decomposition.
The electrolyte solution is a crucial part of a typical Lithium-ion battery, consisting Li salt (f.e. LiPF6), organic carbonates and additives to ensure a stable transport of Li ions during charging and discharging processes. A significant part of battery aging can be considered as a result of the decomposition of the electrolyte. At the end of this chemical and electrochemical processes oligomeric organic compounds 1) and organophosphates 2,3) could be detected. Especially fluor containing organophosphates are of interest due to their potential neurotoxicity 4,5,6).
While the electrochemical aging takes place in a battery itself, the chemical aging starts already during manufacturing, storage and transport of the electrolyte. Typical factors that influence this are: exposure to air and moisture, too high temperature at manufacturing/storage, long term storage in general. Wrong materials in the production pipeline like glass are problematic as well due to a catalytic reaction of the fluoric acid traces with SiO2 as follows:
SiO2 + 6HF → H2[SiF6] +2H2O
This application examples of analysis of the electrolyte solution for qualitative determination of fluorophosphates as a possibility for an earlystage quality control.
Experimental
25 µl LIB electrolyte consisting Ethyl methyl carbonate and Ethylene carbonate 1:1 with 1M LiPF6 has been diluted with 1 mL dichloromethane and centrifuged for 5 min at 8500 rpm to remove the solid LiPF6. The centrifuged solution was transferred into a 2 mL GC glass vial and measured by GCMS-QP2020 NX.
Conclusion
LiPF6 based LIB electrolyte degrade during chemical and electrochemical processes. With GC/MS based analysis method a clear assignment of tree fluorinated alkyl phosphates has been successfully accomplished in a long-term stored electrolyte showing the suitability of GCMS-QP 2020 NX to offer a reliable and simple way of analysis even at early stages of electrolyte decomposition.
3. Thermo Fisher Scientific: Enhanced calibration precision: Leveraging RSE and WLS for optimal function optimization
- Technical note
- Full PDF for download
This technical note outlines the advantages of employing relative standard error (RSE), weighted least squares (WLS) approximations, and inverse calibrations in enhancing the accuracy and precision of calibration in chromatographic analysis. It discusses the shortcomings of conventional metrics and introduces a more dependable and straightforward method for evaluating and optimizing calibration processes.
Software
Data evaluation was performed using Thermo Scientific™ Chromeleon™ Chromatography Data System (CDS) version 7.3.2. The software's RSE definition (Equation 4) includes weighting factors, expanding its use to calibration functions that must pass through the origin.5
Results and Discussion
We included a gas chromatographic (GC) example to demonstrate the universal applicability of RSE in evaluating chromatographic calibration experiments. Figure 7 shows the separation of ethanol, which takes about 40 seconds after a headspace injection. The calibrated concentration range spans from 100 mg/L to 5,000 mg/L, the broadest range in our examples.
We subjected the original method to RSE evaluation using OLS that constrained the calibration function to pass through the origin (Figure 7A). The RSE obtained was 7.6%, which is well within the EPA guideline of less than 20%. However, the relative amount deviation plot in Figure 7A showed increasing deviation at lower standard concentrations.
The original calibration data set was re-analyzed using WLS with a quadratic fit and 1/Amount² weighting to enhance precision. This adjustment reduced the RSE to approximately 0.7%. It produced a relative amount deviation plot in Figure 7B that displayed minor deviations and a random scatter around the target value of 0% across the calibrated range. This demonstrates the improved accuracy and reliability of the optimized calibration method.
Conclusion
This technical note explores the advantages of using RSE, WLS approximations, and inverted calibrations to enhance calibration quality in chromatography. By optimizing calibration curves through quadratic fitting, offset adjustments, and suitable weighting factors (such as 1/Amount²), the calibration process can be significantly improved, resulting in lower RSEs and better overall calibration quality. Incorporating RSE as an evaluation tool offers a deeper understanding of calibration reliability.