Volatile Organic Compound Profiling of Commercial Poi Products in Fresh and Aged States Using Comprehensive Two-Dimensional Gas Chromatography
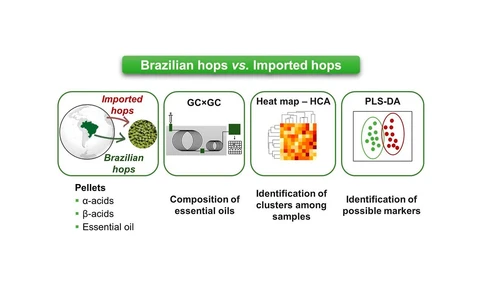
ACS Omega 2025, 10, 20, 20754–20762: Graphical abstract
Poi is a traditional fermented food prepared from taro, yet its volatile organic compound (VOC) composition has not been comprehensively characterized. In this study, commercial poi products from three Hawaiian brands were analyzed to establish a core VOC profile and to assess changes associated with aging and fermentation.
Using headspace SPME Arrow extraction and comprehensive two-dimensional GC–qMS with FID, 56 VOCs spanning 11 compound classes were identified. All brands showed clear differentiation between fresh and aged samples, with fresh poi containing 4,4-dimethoxy-3-methylbutan-2-one and aged poi containing 2,5-dimethylfuran. While fresh products exhibited distinct brand-specific profiles, aged samples showed substantial overlap, indicating convergence of VOC profiles during fermentation. Multivariate analysis supported these findings, enhancing understanding of the chemical characteristics and evolution of commercial poi.
The original article
Volatile Organic Compound Profiling of Commercial Poi Products in Fresh and Aged States Using Comprehensive Two-Dimensional Gas Chromatography
Sarah C. Foster, Cynthia Cheung, Laura Tipton, Jonathan D. Baker, Kahoalii K. Keahi-Wood, and Katelynn A. Perrault Uptmor*
ACS Omega 2025, 10, 20, 20754–20762
https://doi.org/10.1021/acsomega.5c01820
licensed under CC-BY 4.0
Selected sections from the article follow. Formats and hyperlinks were adapted from the original.
Taro (Colocasia esculenta L.) is a tropical corm with origins in southeast Asia and today is found in tropical and subtropical regions around the world. The growth and cultivation of taro have historical roots in the Pacific Islands, especially ‘Hawai‘i. Due to its humid climate, Hawai‘i offers ideal conditions for producing taro. (1) Apart from its agricultural prominence, taro is significant in its medicinal and nutritional applications; it is often fed to infants with indigestion and is a significant source of probiotics, vitamins, and minerals. (2,3) Poi is a food product made from the taro corm, the underground storage organ of the plant, that has been steamed, macerated, and fermented. (2) Although poi is still commonly prepared within households, there are also several brands that are available commercially and can be purchased at grocery stores.
The flavor of food products is associated with a broad array of volatile organic compounds (VOCs) originating from their ingredients. The biological process of fermentation also contributes to this VOC profile. (4) The mixture of VOCs from poi and its fermentation can be examined through analytical techniques, such as gas chromatography (GC). Traditional GC techniques separate analytes within a capillary column coated with a stationary phase, which allows analytes to separate based on their chemical affinity for the column coating. More complex samples benefit from the higher resolution and separation capacity of comprehensive two-dimensional gas chromatography (GC×GC), which is becoming common for the analysis of many food and beverage industries such as beer, wine, honey, olive oil, and more. (5) In GC×GC, separation is performed using two columns with different stationary phases separated by a modulator, which allows separation based on two independent retention mechanisms. (5) This improves the identification of components in complex samples as it reduces uncertainty resulting from the coelution of compounds with similar properties. (6) Further analysis can be achieved through combining GC×GC with mass spectrometry detection. (7) Quadrupole mass spectrometry (qMS) data (albeit slower than time-of-flight) has been previously shown to be capable of sufficient data rate for integration and is often combined with a secondary detector such as a flame ionization detector (FID). (8) While the qMS/FID dual detection approach is common in petroleum industries, it has also been demonstrated previously on forensic samples (8) and other Hawaiian food products. (9) The application of GC×GC in food industries has become increasingly relevant as studies focus on the link between aroma and food consumption, as well as the use of aroma to detect food origin, quality, adulteration, shelf life, and more. (6)
Due to sufficient detector linearity and acquisition rate for analysis previously demonstrated, (8) this study focused on applying qMS stream data from a GC×GC instrument equipped with reverse fill/flush modulation for the differentiation of poi sample types. GC × GC-qMS has been used in prior aroma profiling studies, including those related to fermentation. (10,11) Several studies using GC and GC–MS have been conducted on fresh taro corm to determine its volatile constituents. (12−14) Further, Huang et al. utilized high-performance liquid chromatography to quantify changes in organic acids and simple sugars in fermented poi as well as microbiological techniques to identify the bacteria responsible for the fermentation process. (15) However, there is limited research pertaining to the aroma profile of poi specifically, and no study has ever employed the nontargeted power of GC×GC for this application.
This study aimed to observe changes in fresh to aged commercially purchased poi using comprehensive two-dimensional GC-quadrupole mass spectrometry with flame ionization detection (GC×GC–qMS). The purpose of this investigation was separated into three goals to establish: (1) a core VOC profile of poi, (2) differences in VOC profiles of three commercial poi products, and (3) changes to the VOC profile that occur during the fermentation of poi products. Providing a more detailed profile of the composition of poi products will serve to improve the understanding of their flavor and aroma and its historical context through cross-referencing the chemical profile against traditional uses, as well as better understand its use as a contemporary food product.
Results and Discussion
VOC Profiles of Commercial Poi Products
While each of the three commercial poi brands shared a core set of VOCs, they also contained unique VOCs that could help differentiate one brand from another. These similarities and differences are highlighted in Figure 1. Hanalei brand poi contained 46 total analytes, 12 of which were found only in the “fresh” state, 11 of which were found only in the “aged” state, and 23 of which were found in both the fresh and aged states. He Mea Ono brand poi contained 45 total analytes, 8 of which were found only in the “fresh” state, 9 of which were found only in the “aged” state, and 28 of which were found in both the fresh and aged states. Taro brand poi contained 36 total analytes, 7 of which were found only in the “fresh” state, 13 of which were found only in the “aged” state, and 16 of which were found in both the fresh and aged states.
 ACS Omega 2025, 10, 20, 20754–20762: Figure 1. Venn diagram illustrating the relationship between number of compounds found in Hanalei (HA) brand poi, He Mea Ono (HMO) brand poi, and Taro brand poi for (A) fresh samples and (B) aged samples. Numbers in each space represent the number of analytes identified in common between groups. Numbers in parentheses for each brand provide the total number of analytes detected for the indicated aging state.
Changes in the VOC Profile of Poi Products as Fermentation Occurs
Examining the trends in compound classes as commercial poi products ferment provides information about the changes in the VOC profile that occur during their fermentation. Not accounting for aging status, the 56 total analytes were spread between 11 compound classes with esters contributing to 33.93% of the total volatile profile, alcohols contributing to 12.50%, ketones, nitrogen-containing compounds, and alkenes contributing 8.93% each, aldehydes and carboxylic acids both contributing 7.14% each, sulfur-containing compounds, heterocyclic compounds, and alkanes accounting for 3.57% each, and epoxides making up 1.79%.
Comparing the compound classes of the analytes found in only fresh states and the analytes found in only aged states reveals a shift in the number of components in each class as aging occurs (Figure 3). While changes differed by brand, during aging, the number of alcohols and carboxylic acids increased across all the brands and the number of ketones decreased across all the brands, both changes consistent with the fermentation process. Taro brand poi saw an increase in esters and a decrease in aldehydes. In Hanalei brand poi and He Mea Ono brand poi, the number of esters decreased during aging. However, Hanalei brand poi had a decrease in aldehydes during aging while He Mea Ono brand poi had an increase in aldehydes.
 ACS Omega 2025, 10, 20, 20754–20762: Figure 3. Bar charts demonstrating the number of analytes (count) identified for each compound class among analytes found only in the fresh state across Hanalei (HA) brand poi, He Mea Ono (HMO) brand poi, and Taro brand poi (left) and compound classes among analytes found only in the aged state across Hanalei (HA) brand poi, He Mea Ono (HMO) brand poi, and Taro brand poi (right). Error bars are not shown because total count was used.
The 24 core components previously identified belong to the same compound classes across the fresh and aged states due to their consistent presence in both aging states, so there was no shift seen when analyzing the fresh and aged states separately. Out of the 24 core components, esters contributed to 33.33%, alcohols and ketones contributed to 12.50% each, aldehydes, ketones, and nitrogen-containing compounds accounted for 8.33% each, and alkanes, alkenes, heterocyclic compounds, and epoxides made up 4.14% each. The distribution of class compounds within the core components is similar to the overall distribution of class compounds when looking at all 54 analytes. However, slight differences between the two distributions suggest that changes did occur during fermentation.
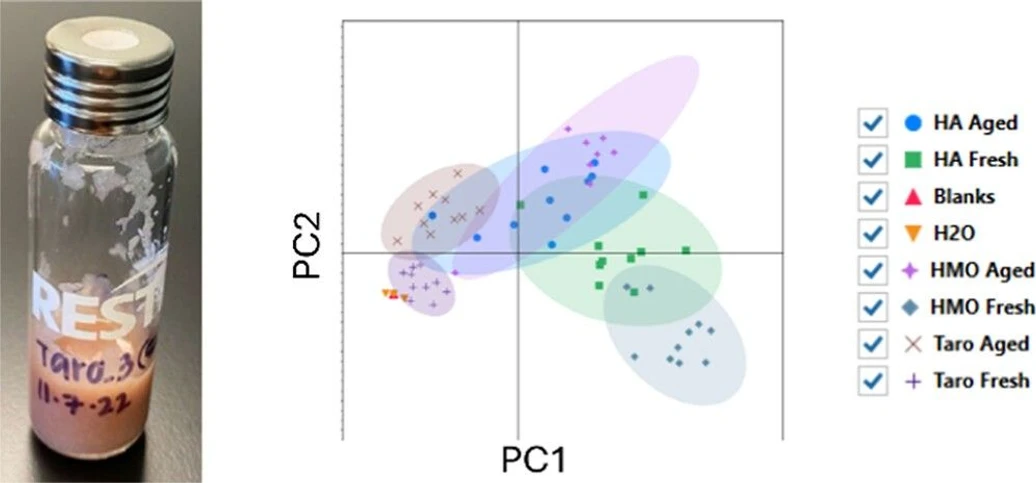
Data presented above in Figures 1–3 are based on the compound presence and number of compounds identified. Another method of visualizing the changes that occurred to the VOC profile of commercial poi products during fermentation is Principal Component Analysis (PCA) based on peak areas for each analyte, as shown in Figure 4. A PCA scores plot demonstrates similarities between different samples based on the entire multivariate structure of a data set, and 95% confidence ellipses represent the confidence interval around a defined group. The method and water blanks were included in the PCA to provide a point of comparison for which poi samples exhibited the least abundant VOC profile. Water and blank samples exhibited very low abundance for all VOCs detected, as noted in Figure 2; therefore, the sample groupings located close to the water and blank samples had a lower abundance of VOCs in the samples.
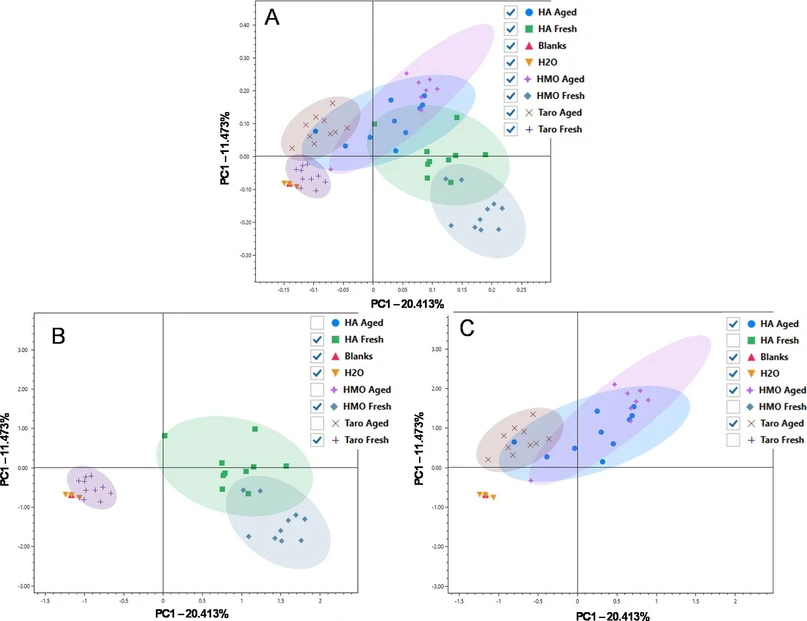 ACS Omega 2025, 10, 20, 20754–20762: Figure 4. PCA scores plot depicting (A) all fresh samples, all aged samples, water, and blanks, (B) “Fresh” PCA scores plot, (C) “Aged” PCA scores plot. Category marker key pictured far right. Hanalei brand poi is referred to as “HA”, He Mea Ono brand poi is referred to as “HMO”, and Taro brand poi is referred to as “Taro”. Colored circles represent pareto scaling with Log transformations and a 95% confidence ellipse around the different groups. Note that all fresh and aged samples are plotted in the same PCA scores plot, and plots (A) and (B) were generated by hiding or viewing groups within software. They were not generated based on two separate analyses but are shown on two different plots to improve visualization of fresh and aged states.
Conclusions
The goal of this study was 3-fold in establishing a core VOC profile of poi, differences in VOC profiles of three commercial poi products, and changes to the VOC profile that occur during the fermentation of poi. The core VOC profile of poi consisted of 24 VOCs spanning 10 different compound classes contributing to a general sweet, fruity, and nutty aroma. The three brands examined, Hanalei brand poi, He Mea Ono brand poi, and Taro brand poi, each had a distinct aromatic profile in the “fresh” state versus the “aged” state. While the brands overlapped in a number of VOCs, unique components help to differentiate each brand from the others. The overall chemical shift from “fresh” to “aged” involved a difference in the number of analytes present in each compound class. Alcohols and carboxylic acids increased consistently with aging among all brands, while ketones decreased with aging among all brands. The use of PCA established the similarities between brands based on component peak areas. Further studies could explore the odor profile of poi at different stages in the aging process to determine an “optimal” time of consumption based on chemical data.
This study is significant in its exploration of the VOC profile of poi in connection with its traditional medicinal uses and its contemporary place in the consumer market. Applying knowledge about the chemical composition of poi along with its established odor descriptors can explain consumer preferences as well as contribute to the ongoing research about poi’s nutritional and probiotic benefits.
Methods
SPME Arrow Sampling
Solid phase microextraction arrow sampling with a 1.50 mm wide sleeve divinylbenzene/carbon wide range (CWR) fiber (Restek Corporation, Bellefonte, PA) was performed using 20 mL headspace vials (Restek Corporation) containing approximately 5 g of poi or the extracted water sample. This fiber was chosen due to success in similar studies. (9) The exact mass of each sample was recorded on an analytical balance for normalization purposes in data processing. Sample extraction and injection were performed using a TriPlus RSH Autosampler (Thermo Scientific, Waltham, MA, USA). Sample incubation was performed at 35 °C for 5 min at 500 rpm. Sample extraction was performed at 35 °C for 5 min at 1000 rpm. The needle speed was 20 mm/s in the vial, and the needle depth was set to standard. The incubation mode was constant. Injection was performed to a depth of 45 mm with a 35 mm/s penetration speed for 1 min. SPME arrow fibers were conditioned for 30 min at 260 °C prior to each sequence and were confirmed as blank with a fiber blank injection. SPME arrow fibers were reconditioned with a predesorb time of 2 min and a postdesorb time of 5 min between each run. All samples were run over a short period (less than 3 days) for each condition (fresh and aged), and no other projects were run between the two analyses.
GC×GC–qMS Method
The instrument used for analysis of VOCs from poi samples was a TRACE1300 GC/FID and an ISQ 7000 Single Quadrupole Mass Spectrometer (Thermo Scientific). Although FID data were collected at the time of sample analysis as part of a course-based undergraduate research experience, the FID data were not included in the analysis, and only the qMS data were used herein. The inlet was operated in split mode with a split flow of 20 mL/min and a purge flow of 2.000 mL/min. The inlet temperature was 250 °C. The first-dimension column was an Rxi-624Sil MS column (30 m × 0.25 mm ID × 1.4 μm film thickness, Restek Corporation), and the second-dimension column was a Stabilwax (5 m × 0.25 mm × 0.25 μm film thickness, Restek Corporation). An INSIGHT Reverse Fill/Flush Modulator (SepSolve Analytical, Peterborough, UK) was used with a modulation period of 2.5 s and a flush time of 100 ms. The loop dimensions were 0.53 × 1133 mm ID with a resulting loop volume of 25 μL. The bleed line dimensions were 5 × 0.1 mm ID. Ultrahigh purity helium (Airgas, Radnor, PA, USA) was used as the carrier gas. The flow rate in the first-dimension column was 1.00 mL/min, and the auxiliary gas flow rate was 20.0 mL/min, with a calculated flow rate of 17.9 mL/min in the second dimension. The flow was split between the FID and MS using an unpurged SilFlow GC 3-port splitter (Trajan Scientific and Medical, UK) at approximately 4.5:1, which was maintained throughout the run. An uncoated fused silica column was used to connect the splitter device to each of the FID and MS. The GC oven started at 50 °C, was held for 1 min, increased to a final temperature of 250 °C at the rate of 5 °C/min, and held for 1 min. The total run time was 42 min.
The ion source temperature and the transfer line temperature for the qMS were both set to 280 °C. The qMS was operated in the electron ionization mode with a scan range of 40 to 300 m/z. The total scan time was 0.0241 s, which resulted in an acquisition rate of 41.5 scans/s. This is the maximum acquisition rate for this instrument when using this scan range. Instrument control was performed using Chromeleon 7 version 7.2.9 (Thermo Scientific).