Pixel-Based Chemometric Analysis of Pre-Salt Crude Oils: Advancing GC×GC-TOFMS for Reservoir Characterization
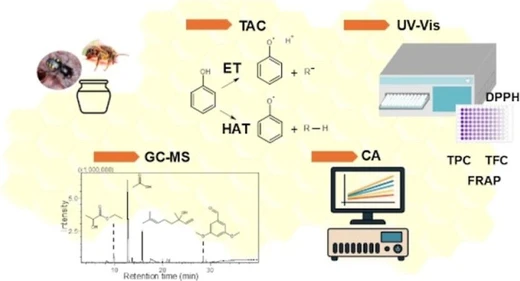
Energy Fuels 2025, 39, 15, 7204–7213: Graphical abstract
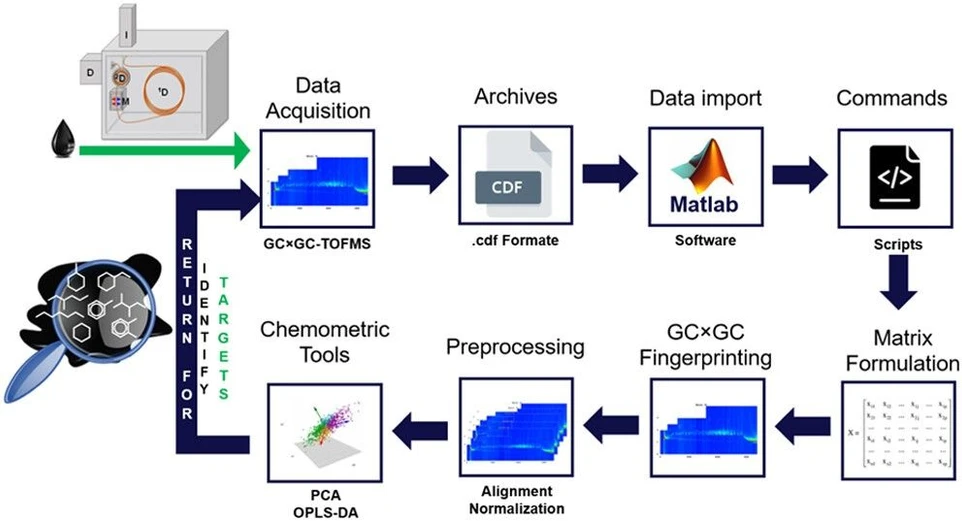
Comprehensive GC×GC-TOFMS is widely used to characterize petroleum, but traditional targeted approaches can be slow and limited for large, complex data sets. A pixel-based preprocessing workflow enables rapid, untargeted chemometric exploration of two-dimensional chromatograms, allowing researchers to visualize subtle compositional differences in complex crude oils.
Using this strategy, fifty Brazilian pre-salt crude oils from the Búzios field were analyzed to investigate variations in light hydrocarbons. After alignment, normalization, and multivariate analysis of total ion chromatogram matrices, PCA revealed minor yet meaningful differences among samples, while OPLS-DA successfully distinguished oils from the Barra Velha and Itapema formations—attributing lighter hydrocarbons to Barra Velha. These results demonstrate that pixel-level chemometrics is a powerful, high-throughput alternative for reservoir characterization, offering faster, more detailed insight than traditional GC×GC-TOFMS workflows.
The original article
Pixel-Based Chemometric Analysis of Pre-Salt Crude Oils: Advancing GC×GC-TOFMS for Reservoir Characterization
Mônica C. Santos*, Dayane M. Coutinho, Clarisse L. Torres, Thamara A. Barra, Victor G. K. Cardoso, Raquel V. S. Silva, Daniel S. Dubois, Joelma P. Lopes, Francisco R. Aquino Neto, and Débora A. Azevedo*
Energy Fuels 2025, 39, 15, 7204–7213
https://doi.org/10.1021/acs.energyfuels.5c00243
licensed under CC-BY 4.0
Selected sections from the article follow. Formats and hyperlinks were adapted from the original.
Our research group has employed advanced chromatographic techniques to analyze complex matrices over the past two decades, mainly focusing on Brazilian crude oil. (21−24) GC×GC-TOFMS analysis has emerged as a pivotal tool in these studies. Vale et al. (25) demonstrated that significant improvements in crude oil sample characterization can be gained by integrating GC×GC-TOFMS with high-order chemometric methods, especially N-way partial least-squares analysis (N-PLS). Their innovative approach supports the precise calibration and prediction of properties such as American Petroleum Institute gravity (API gravity) and wax appearance temperature (WAT), achieving high accuracy and low error rates. In another work, (26) the authors used GC×GC-TOFMS with PCA analysis to assess the source- and maturity-related geochemical parameters of 11 Brazilian crude oil samples, yielding maturation indicators. These studies highlight the potential of GC×GC-TOFMS combined with chemometrics in advancing crude oil characterization; enhancing our understanding of molecular composition, biodegradation processes, source information, and maturity through enhanced data resolution and reduced data set dimensionality.
As part of the ongoing stream of research on advancing analytical methods for crude oil characterization, (7,27) this work explores a novel and rapid untargeted approach to GC×GC-TOFMS data treatment with high sensitivity to detect slight differences between complex samples. This method integrates GC×GC-TOFMS analysis with pixel-based data processing and multivariate statistical analysis to differentiate the light hydrocarbon compositions (C5–C15) of 50 presalt crude oil samples from the Búzios field in Santos Basin, Brazil. This promising analytical tool can be used to support reservoir geochemistry in oil–oil correlation studies.
2. Materials and Methods
2.4. GC-FID
GC-FID analyses were performed using a 6890N Network Gas Chromatograph equipped with a fused silica capillary column and a 5%-phenyl-95%-methyl-siloxane HP5-MS film (Agilent Technologies; 30 m × 0.25 mm di; 0.25 μm df). Previous studies have described the experimental conditions we adopted. (33,34) The samples were prepared by dissolving 10 mg of crude oil in 500 μL of a mixture containing deuterated internal standards (n-hexadecane-D34 and n-tetracosane-D50) at a final concentration of 100 μg mL–1. Whole oil chromatogram profiles were used to assess contamination by drilling fluids.
2.5. GC×GC-TOFMS
The analyses were carried out using comprehensive two-dimensional gas chromatography (GC×GC) coupled with a time-of-flight mass spectrometry (TOFMS) system (Pegasus 4D, Leco, St. Joseph, MI). The experimental parameters were optimized in accordance with previous research. (7) The column set consisted of a DB-5 ms (30 m, 0.25 mm ID, 0.25 μm) in the first dimension and a DB-17ht (1.0 m, 0.25 mm ID, 0.15 μm) in the second dimension (Agilent Technologies) to enhance the separation and detection of light hydrocarbons, particularly in the C5–C15 range. (35)
The GC oven temperature was programmed from 35 °C (hold 3 min) to 40 °C with a heating rate of 1.0 °C min–1. The oven was then heated to 160 °C at 3.0 °C min–1. Finally, a heating rate of 20 °C min–1 was employed up to 330 °C. Helium was the carrier gas with a constant flow rate of 1.0 mL min–1. The transfer line temperature was set to 280 °C, with the ion source temperature at 230 °C, electron energy at 70 eV, mass scanning range from m/z 25 to 600 Da, and acquisition rate at 100 spectra/second. The cold-jet–hot-jet ratio between the stages was set to 2:1. The modulation periods applied were variable. Detailed information on these modulation periods, time intervals, and variable intervals can be found in the Supporting Information.
The samples were prepared by solubilizing 10.0 mg of the crude oil in 200 μL of a carbon disulfide solution containing the internal standards (IS) 2,4,4-trimethyl-1-pentene, dodecane-D26, methylcyclohexane-D14, Bicyclo[4.4.0]decane-D18 (decalin-D18), toluene-D8, p-xylene-D10, and naphthalene-D8 at a concentration of 100 μg mL–1. The selected IS represent a variety of hydrocarbon classes, including n-alkanes, iso-alkanes, naphthenes, and aromatics, covering different molecular weights. Each crude oil was weighed and solubilized in a carbon disulfide solution containing the mixture of internal standards. Immediately after, the vial was capped and kept in the refrigerator at 4 °C until analysis to avoid the loss of most volatile compounds.
3. Results and Discussion
3.2. Untargeted Pixel-Based GC×GC-TOFMS Approach
GC×GC-TOFMS crude oil analysis provided information-rich chromatographic profiles of compounds in the range of C5–C15. Different hydrocarbon classes were separated in the two-dimensional chromatogram space according to their volatility and polarity properties: n-alkanes, iso-alkanes, aromatic, and naphthenic compounds. Figure 1 shows the characterization of light hydrocarbons by class for two samples: #12 (from the Barra Velha Formation) and #1 (from the Itapema Formation). Depending on the signal-to-noise ratio applied in the conventional processing method, around 1,000 peaks may be detected and need to be checked manually by an analyst, which takes considerable time. Additionally, most crude oil samples exhibit similar GC × GC-TOFMS chromatogram profiles, as illustrated by Figure 1.
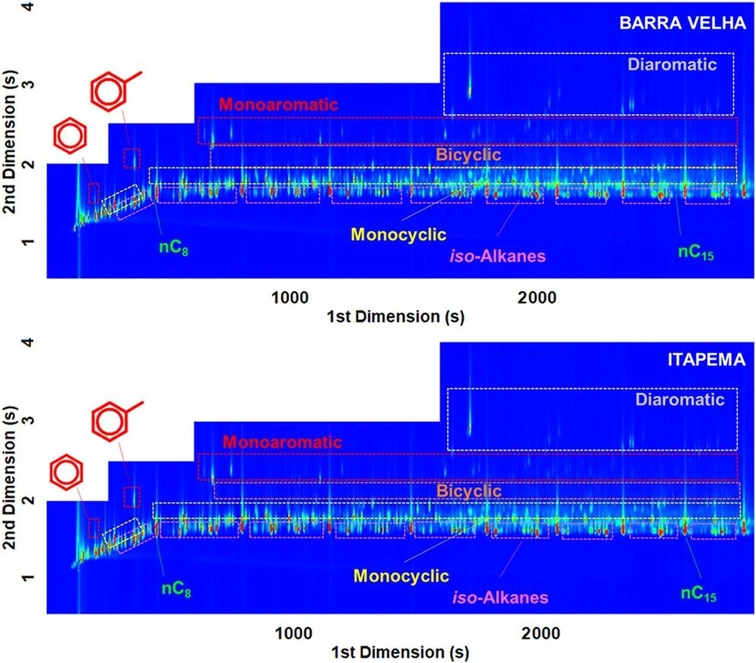 Energy Fuels 2025, 39, 15, 7204–7213: Figure 1. Total ion chromatograms of samples #12 (Barra Velha Formation) and #1 (Itapema Formation) obtained by GC×GC-TOFMS analysis.
The high compositional homogeneity among the studied samples illustrates the complexity of identifying subtle differences in crude oil samples from the Búzios field. This shows how challenging grouping crude oil according to their molecular composition can be, especially when low-concentration compounds are relevant to the differentiation. In this regard, untargeted approaches followed by chemometric analyses have become promising tools for achieving deeper crude oil correlations without assessing peaks individually.
3.2.1. PCA and OPLS-DA Analyses
Unsupervised PCA analysis was used as an exploratory model for the 50 GC×GC-TOFMS crude oil profiles that employed ROI 1 (range: n-C6–n-C13 in Supporting Information). The PCA score plot (Figure 2A) showed a slight tendency to separate samples by GC×GC-TOMFS chromatogram profile, roughly grouping the test samples according to their geological formation of origin. The supervised OPLS-DA method was then used for sample classification, with the Itapema and Barra Velha formations incorporated as labels in the analysis (Figure 2B). The main advantage of OPLS-DA is that class information can be used to maximize covariance with chromatographic profiles. (45) An orthogonalization procedure in which the variance is related to class discrimination in the first latent variable (LV 1) facilitates more rigorous model interpretation. (46)
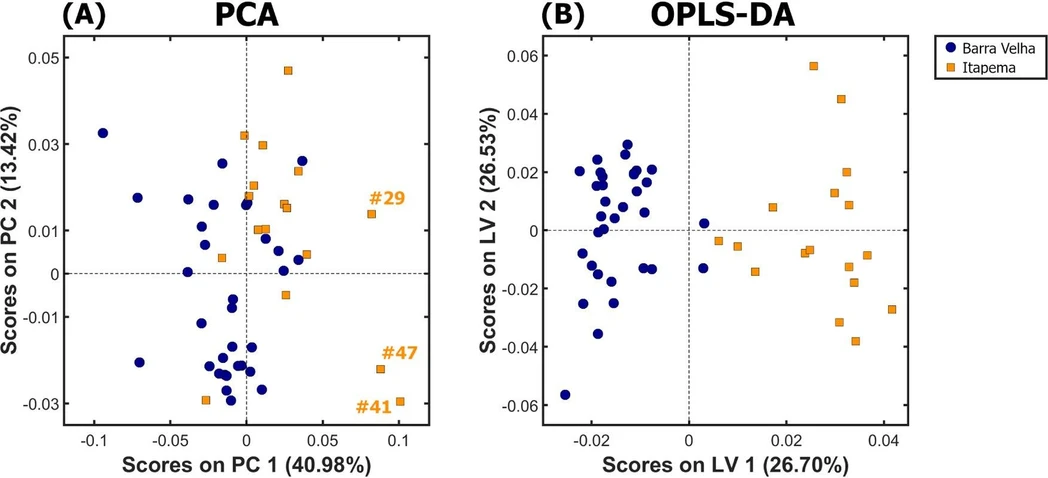 Energy Fuels 2025, 39, 15, 7204–7213: Figure 2. Score plot of (A) PCA model applied to distinguish crude oils showing the identification of the three highly contaminated samples (#29, #41, and #47). (B) OPLS-DA model applied for sample classification. Itapema formation is represented by orange squares and Barra Velha by blue circles.
Therefore, when comparing OPLS-DA and PCA analysis, it was observed that the capacity to differentiate between the geological formations was improved using the supervised model. Nevertheless, based on the OPLS-DA loadings of the reconstructed chromatogram per pixel using MATLAB (Figure 3), this separation was partly influenced by the presence of olefins, which are absent from crude oil but known to be a common constituent of drilling fluids. (47) By checking the PCA score plot, three crude oil samples from the Itapema formation with high PC1 values (#29, #41, and #47) were strongly contaminated with drilling fluid (Table 1). This result shows that interference related to drilling fluid (an external source of compounds) may prevent the identification of slight differences in light hydrocarbons. Therefore, samples #29, #41, and #47 were removed from the original set. Additionally, a new ROI (ROI 2, n-C6-n-C12 range in Supporting Information) was established in the GC×GC chromatogram to avoid any remaining contaminant peaks without missing relevant information.
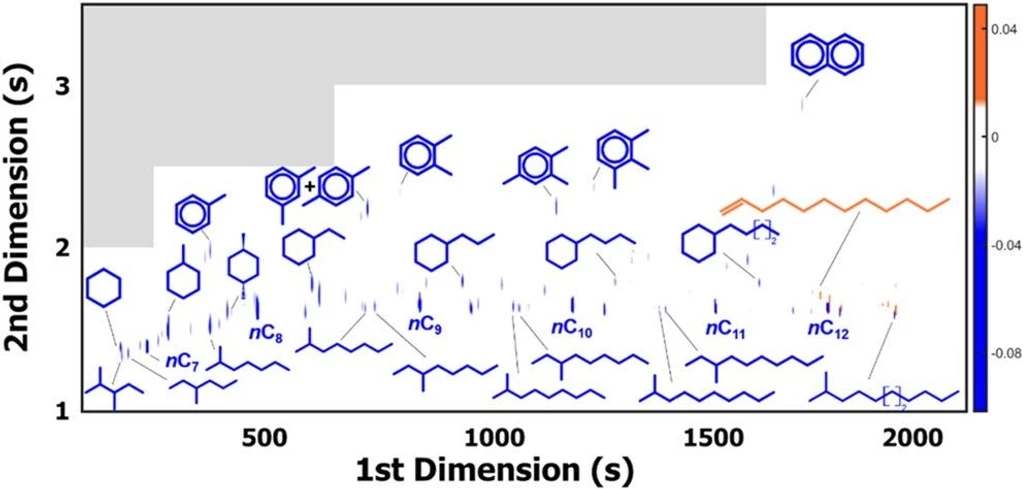 Energy Fuels 2025, 39, 15, 7204–7213: Figure 3. Loadings of the OPLS-DA model comprising the most important variables (compounds) that express the differences between Itapema and Barra Velha formations. Itapema formation is enriched in olefins related to contamination by drilling fluids.
4. Conclusions
This analytical strategy enabled the identification of subtle differences in fluid composition that facilitated the differentiation of samples from the Barra Velha and Itapema formations. Supervised OPLS-DA analyses indicated the critical light hydrocarbons that enabled this discrimination.
The results show that the Barra Velha formation is enriched with lighter hydrocarbons than the Itapema formation. Additional PCA analysis revealed potential differences between crude oil samples within each geological formation. In the Barra Velha Formation, three samples were highlighted as distinct from the main group (#43, #7, and #9), while in the Itapema Formation, only sample #4 was distinct. This information shows that even when samples are very similar, it is still possible to identify slight differences that provide a better understanding of the fluid distribution and its relationship with the reservoir characterization.
Pixel-based chemometrics proves to be a rapid and innovative complement to crude oil characterization, representing a faster alternative to the current methodologies used to process and analyze GC×GC-TOFMS data. In sum, a complex oil–oil correlation case study encompassing 47 presalt crude oil samples from Búzios Field was addressed by identifying sample-distinguishing analytes, which can be further explored with targeted chemometric tools.