Fingerprinting of Peach During the Ripening Process Using an Analytical Platform with Spectrometric and Volatilome-Based Chromatographic Techniques
J. Agric. Food Chem. 2025, 73, 26, 16636–16647: Graphical abstract
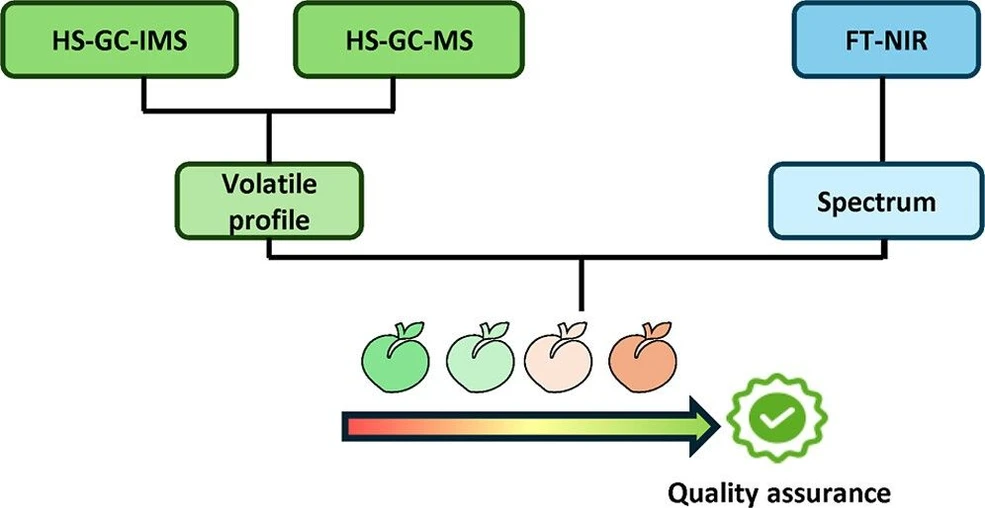
This study investigates peach ripening using Fourier transform near-infrared spectroscopy and volatilome-based headspace gas chromatography coupled to ion mobility spectrometry and mass spectrometry. A total of 344 samples from two varieties at different ripening stages were analyzed to identify optimal harvest timing.
Principal component analysis revealed distinct clustering of samples by ripening stage. Using these groups, partial least-squares discriminant analysis models successfully differentiated both ripening stages and varieties. The results demonstrate strong potential for volatilome profiling with HS-GC–IMS and HS-GC–MS as reliable tools for monitoring peach quality.
The original article
Fingerprinting of Peach During the Ripening Process Using an Analytical Platform with Spectrometric and Volatilome-Based Chromatographic Techniques
Claudia Giménez-Campillo, Natalia Arroyo-Manzanares, Marta Pastor-Belda, Natalia Campillo, Lukas Bodenbender, Philipp Weller, and Pilar Viñas*
J. Agric. Food Chem. 2025, 73, 26, 16636–16647
https://doi.org/10.1021/acs.jafc.5c01524
licensed under CC-BY 4.0
Selected sections from the article follow. Formats and hyperlinks were adapted from the original.
Peach, along with nectarine, plum, apricot, cherry, and almond, belongs to the genus Prunus (genus described by Charles Linnaeus in 1753). (1) Originally from China, it is the second most important fruit in Europe after apple, (2) is of great economic importance, and is consumed fresh, canned and in juice. It is rich in vitamins, minerals, and antioxidants. Currently, in addition to China, there are other world leaders in the production of this fruit, including Spain, Italy, Turkey, and Greece. (3)
In recent decades, consumer complaints about poor fruit quality have often been the result of premature harvesting for commercial reasons. This practice, while facilitating transport and distribution by extending the fruit’s presence in the market, has a negative impact on its flavor, texture, and nutritional value. Consequently, ripening monitoring and control have become an important part of fruit management. (4) Despite extensive research on the physicochemical properties of peaches during the ripening stage to obtain adequate maturity indices, objective indicators of consumer acceptance are still lacking. (5) Ripening time has been shown to be directly related to flavor characteristics, which are influenced by sugar accumulation, acidity, and the production of low-molecular-weight volatile organic compounds (VOCs), (6) also called volatilomes. Therefore, VOCs can be a key indicator in peach quality assessment. Understanding exactly which VOCs are responsible for aroma at different ripening stages can help to develop rational and objective methods to ensure high-quality fruit, both in consumption and processing. (7) This approach would not only be beneficial for consumers, who would receive products with optimal flavor, texture, and nutritional value, but also would support producers.
A literature review reveals the existence of several studies on the characteristic volatile profile of peaches. (1,8−14) However, it is important to note that there is a significant lack of research on the variation of these compounds during ripening. (15) Most of the works on VOC determination used gas chromatography coupled to mass spectrometry (GC–MS) (1,6,8−19) and solid-phase microextraction as the sample preparation technique. (6,9−12,15−17,19) In recent years, ion mobility spectrometry (IMS) has been used as an alternative technique for the determination of VOCs in peach. (11,12,18,20,21) The aim of these studies was to investigate the volatile profile, (11) the differentiation between varieties, (18) and the influence of packaging and storage of this fruit. (20,21) Therefore, the current state-of-the art techniques reveal that GC–MS and GC–IMS techniques have not been applied to predict peach ripening. It has been shown that it is possible to predict optimal ripening by near-infrared spectrometry (NIR) in relation to the measurement of different parameters, such as soluble solid content, (22−28) flesh firmness, (23,26,28,29) pectin content, (30) dry matter, (23−25) absorbance difference index, (25,26) and acidity. (27)
The objective of this work was the development of methodologies for the prediction of the ripening stage of peaches and, therefore, of their quality for the consumer by means of a simple analysis based on their VOC content, applying headspace GC (HS-GC)–MS and HS-GC–IMS techniques and on their Fourier transform near-infrared spectroscopy (FT-NIR) spectral fingerprint. The novelty of the study lies in the fact that correlations have not been established with other chemical parameters measured in peaches, but rather chemometric models based on an analytical platform have been applied to obtain relevant information on the ripening of this fruit. The studies were conducted on two different peach varieties (yellow-fleshed and red-fleshed) grown in one geographical origin of the agricultural sector (Jumilla, Region of Murcia, Spain), which have not been previously analyzed, and chemometric models were also applied to discriminate between these two varieties.
2. Materials and Methods
2.2. Instruments, Analytical Procedures, and Data Processing
2.2.1. FT-NIR Analysis
FT-NIR analysis was performed using a FT-NIR multipurpose analyzer spectrophotometer, equipped with a solid sample compartment, from Bruker Optik GmbH (Ettlingen, Germany).
A weight of 0.5 g of homogenized peach was placed in a vial and measured by FT-NIR in the reflectance mode. Before each analysis, a background scan was performed, and the measurement was repeated five times. Spectral data covered the wavenumber range from 12,500 to 3600 cm–1 with a resolution of 8 cm–1 and are expressed in units of absorbance. Each spectrum was obtained from 32 scans, and the average of the five measurements for each peach sample was calculated to obtain a representative spectrum.
The FT-NIR software used to process the data was OPUS software, version 8.5. In addition, the data set obtained was subjected to three transformations using Unscrambler X software. Multiplicative scattering correction was applied to correct for the effects of particle-size-induced light scattering effects. Next, Savitzky–Golay smoothing was applied (window = 9, polyorder 2, first derivative) to reduce the inherent instrumental noise and to correct for the additive and multiplicative effects present in the spectrum. The full spectrum (2224 features) was used as a variable in the chemometric models constructed from the FT-NIR data. This approach was adopted in order to make use of all available spectral information given the observed variations between the samples across the entire range studied.
2.2.2. HS-GC–IMS Analysis
For GC-IMS analysis, a 6890N gas chromatograph (version N.05.05) from Agilent Technologies (Waldbronn, Germany) was coupled to a G.A.S. (Gesellschaft für Analytische Sensorsysteme) IMS module (Dortmund, Germany). A multipurpose sampler (MPS) from Gerstel GmbH (Mühlheim, Germany) was used, configured for headspace mode and injecting the sample in the gas phase, using a 2.5 mL syringe. The carrier gas was nitrogen with a purity of 99.99%, operated at a constant flow rate of 1 mL min–1, and supplied by Air Liquide (Madrid, Spain). An Agilent HP-5MS UI capillary column (0.25 mm × 30 m with a film thickness of 0.25 μm), consisting of 5% diphenyl and 95% dimethyl polysiloxane, was used for the analysis.
2.2.3. HS-GC–MS Analysis
GC–MS analysis was carried out on an Agilent Technologies (Santa Clara, CA, USA) model 8890 gas chromatograph and an Agilent 5977B quadrupole mass spectrometer equipped with an inert ion source. A Gerstel MPS operating in headspace mode was used for sample injection.
3. Results and Discussion
3.2. Spectral Peach Fingerprint Using FT-NIR
The spectral fingerprints of the peaches analyzed showed very similar profiles, with differences in the absorbance values. Figure 1 shows the FT-NIR spectra of the average raw data obtained from all peach samples collected at different stages of ripeness, recorded in the range 12,500–3600 cm–1. It is observed that as the ripening stage progresses, the absorbance increases in the range 11,800–3600 cm–1.
 J. Agric. Food Chem. 2025, 73, 26, 16636–16647: Figure 1. Raw FT-NIR spectra of the average of all peach samples at different stages of ripening. The figure shows the FT-NIR spectra corresponding to the average of peach samples at different stages of ripeness: the blue spectrum represents unripe peaches, the red spectrum also represents unripe peaches but in a more advance ripeness process, and the green spectrum represents ripe peaches ready for consumption. Also, the most representative absorption bands of the peach observed in the spectra are indicated.
In the spectrum of the different peach samples, four different regions can be identified according to the NIR bands: 12,500–9400 cm–1, 9400–7700 cm–1, 7700–5800 cm–1, and 5800–3600 cm–1. Peach samples contain mainly water (85–95%) in their composition, and therefore characteristic water bands were found from right to left, including bands with different absorbances. In the first region, from 5800 to 3600 cm–1, there is a broad absorption band with a maximum at around 5160 cm–1, which corresponds to the first combination of asymmetric stretching and bending of the water molecule. Also, in this region, there is another narrow and weaker combination band at 5620 cm–1, associated with the bending, asymmetric stretching, and intramolecular modes of the water molecule. In the region between 7700 and 5800 cm–1, a broad band is observed at 6880 cm–1 involving the symmetric and asymmetric stretching modes of the water molecule, known as the first overtone of OH stretching. Between 9400 and 7700 cm–1, there is a second weak combination band involving the symmetric stretching, asymmetric stretching, and bending modes of the water molecule. Finally, in the region from 12,500 to 9400 cm–1, an absorption band related to the asymmetric and symmetric stretching modes of the water molecule is observed, called the second overtone of OH stretching. (35) The spectra show that the maximum absorbance value of each band increases as the ripening stage progresses. This correlation suggests that the ripening process in peaches is associated with an increase in water content, which affects the texture, weight, and possibly the flavor of the fruit.
3.3. Identification and Quantification of Volatile Compounds Using GC–MS and GC–IMS
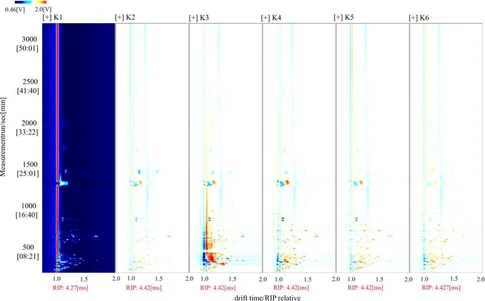
The volatile fingerprint of the peach samples was established by using GC coupled to MS and IMS detectors. Figures 2 and 3 show a topographical map using IMS and a chromatogram obtained by the MS detector for a peach sample, respectively. In both cases, identification of the VOCs was carried out.
 J. Agric. Food Chem. 2025, 73, 26, 16636–16647: Figure 2. Topographic map of a peach sample. The figure shows a topographical map obtained by HS-GC–IMS, indicating the VOCs identified and verified in peach samples.
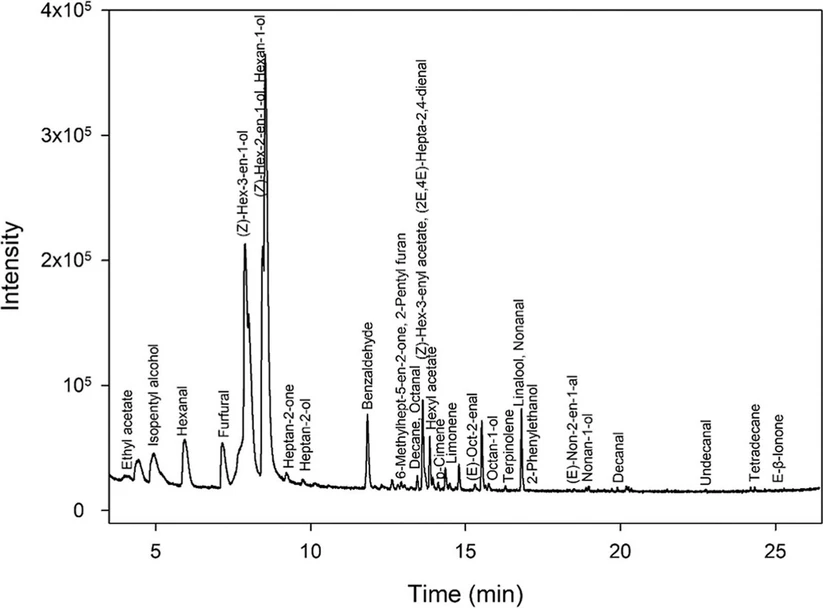 J. Agric. Food Chem. 2025, 73, 26, 16636–16647: Figure 3. Chromatogram of a peach sample. The figure shows a chromatogram obtained by HS-GC–MS, indicating the compounds identified and verified in peach samples.
Untargeted studies were performed by processing the raw data from the HS-GC–MS analysis of the samples using MS-DIAL software under the conditions described in Section 2.2.3. A total of 427 features were extracted from the peach samples, taking into account the different varieties and the whole ripening process.
HS-GC–IMS was used to obtain the topographical maps of all samples. The GC–MS metabolomic MSP spectral library and the GAS IMS library allowed putative identification of some of the features detected.
Conclusion
The results obtained allow us to conclude that both the quality and the specific variety of the peach can be verified by a single analysis of the volatilome or the NIR spectral fingerprint. However, better results are obtained in both cases when working with the volatile profile, since HS-GC–MS and HS-GC–IMS techniques are more powerful and specific tools. Although HS-GC–MS stands out for its high resolution and sensitivity, its high cost, the need for vacuum conditions, and the large size of the equipment limit its applicability in sectors with limited resources such as many fruit quality control companies. In contrast, the HS-GC–IMS technique offers greater simplicity, accessibility, and cost-effectiveness, as it requires less energy and resources, making it a more efficient and sustainable option. (40) Furthermore, its ability to provide results comparable to those of HS-GC–MS, as demonstrated in this work, underscores its potential as an ideal alternative for many studies seeking to reduce resource consumption without compromising analytical quality. (41)
In summary, multiple factors must be considered to determine the best analytical tool for carrying out routine controls aimed at verifying the authenticity of labeling and predicting the optimal stage of ripening in order to prevent food fraud and minimize economic losses. These factors include economic cost, analysis time, complexity of sample preparation, and discrimination capability of the generated models. Although the FT-NIR technique allows for fast and relatively low-cost analysis, its analytical performance is significantly low. In some cases, the classification and validation percentages are close to 70%. HS-GC–MS, on the other hand, has shown very good discrimination capacity (with values above 87%), but it is limited by its high operating cost and greater instrumental complexity. Considering all these aspects, the technique that offers the most balanced approach for implementation in routine controls is HS-GC–IMS, as it combines excellent discrimination capability (with classification and validation percentages above 90% in all cases studied) with moderate analysis times, very simple sample preparation, and not very high operating costs. These features make HS-GC–IMS a particularly suitable tool for practical applications requiring a high degree of reliability, efficiency, and sustainability.
Although the results obtained were very promising, particularly regarding the volatile profiles analyzed by HS-GC–IMS and HS-GC–MS, the study has some limitations. First, the study focused on two peach varieties grown in a specific geographical region, so the applicability of the developed models to other varieties or geographical origin requires additional validation. Furthermore, while the chromatographic techniques used were successful, they call for specialized equipment, which might restrict their use in some situations. Future research should consider expanding the number of varieties and geographical origins.