News from LabRulezGCMS Library - Week 22, 2025
LabRulez: News from LabRulezGCMS Library - Week 22, 2025
Our Library never stops expanding. What are the most recent contributions to LabRulezGCMS Library in the week of 26th May 2025? Check out new documents from the field of the gas phase, especially GC and GC/MS techniques!
👉 SEARCH THE LARGEST REPOSITORY OF DOCUMENTS ABOUT GCMS AND RELATED TECHNIQUES
👉 Need info about different analytical techniques? Peek into LabRulezLCMS or LabRulezICPMS libraries.
This week we bring you application notes by Agilent Technologies, Shimadzu and presentation by University of Alberta / MDCW!
1. Agilent Technologies: Analysis of Phthalates Using the Agilent 5977C GC/MSD with Hydrogen Carrier Gas
- Application note
- Full PDF for download
Plastics are ubiquitous in the modern world and are used in thousands of applications. To tailor mechanical characteristics of plastics, such as flexibility, transparency, and durability for specific uses, esters of phthalic acid are often added to their formulation. These compounds are not covalently bound to the plastics in which they are mixed, and thus, are easily released into the environment. They are present in a wide range of products including wire insulation, children’s toys, packaging, medical devices, pens, and tubing. Many countries now regulate phthalate content in many products. The analytical requirements for phthalate analysis vary depending on the region and products being tested, but GC/MS is usually the preferred measurement technique.
The use of both hydrogen and helium as carrier gas in GC/MS analyses has been demonstrated in previous literature. For example, seven phthalates in polymer materials were successfully analyzed with GC/MS using helium carrier gas and calibrated from 50 to 1,000 ng/mL.1 The calibration performance for 17 phthalates over the range of 10 to 1,000 ng/mL and for two isomeric mixtures (DINP and DIDP) over the range of 125 to 10,000 ng/mL using helium carrier gas and Agilent JetClean self-cleaning ion source has been detailed.2 The use of hydrogen carrier gas, the Agilent HydroInert source, and backflushing for analyzing 10 phthalates in electrical cable samples over a calibration range 200 to 5,000 ng/mL has been achieved.3 Since many laboratories are considering converting from helium to hydrogen carrier gas for GC/MS analyses, it is useful to evaluate the performance of phthalates with hydrogen carrier gas down to low levels (< 10 ng/mL).
This application note focuses on GC/MS in selected ion monitoring (SIM) mode using hydrogen as the GC carrier gas. While helium is generally considered the best carrier gas for GC/MS analysis, its cost and reoccurring shortages have increased demand for applications using hydrogen. When adopting hydrogen for GC/MS analysis, there are several things to consider.
Method Parameters
- GC: Agilent 8890 GC with Agilent 7693A automatic liquid sampler and tray
- Inlet: Multimode inlet (MMI)
- Mode: Pulsed splitless
- Injection Pulse Pressure: 25 psi until 0.90 min
- Purge Flow to Split Vent: 50 mL/min at 1.0 min
- Injection Volume: 1.0 µL
- Syringe: 10 µL, PTFE tip plunger, dual taper needle
(G4513‑80203)
Results and discussion
Interferences and contamination
The sensitivity of the GC/MS method employed here is sufficient to see the 17 individual phthalates at low pg levels (ng/mL). However, interferences and contamination initially limited calibration at the lowest concentrations. The interferences were identified as silicone peaks, and the contamination resulted from low levels of common phthalates found in the consumables and glassware used.
Figure 4 shows an example of the problems encountered when first running isooctane solvent blanks.
The blue trace that ends at 4.3 minutes is the SIM quantifier ion for DMP. Although there are a few peaks present in the blank, they are resolved from DMP and do not interfere.
In the black SIM m/z 149 trace, multiple problems are evident. Significant responses for 1,2-benzenedicarboxylic acid (DIBP), dibutyl phthalate (DBP), and diethyl phthalate (DEP) are present, as are smaller ones for DEHP and DPHP. In addition, a series of peaks identified using scan data as siloxanes (labeled Si) are also observed. The DPHP peak is small and is obscured by the broadened siloxane ghost peak from a previous injection.
Aliquots of approximately 75 µL of each calibration standard or blank isooctane were placed in autosampler vials with a 400 µL silanized flat bottom glass insert (part number 5183-2086). It was found that a significant portion of the phthalate contaminants in blanks was removed by baking the vials, vial inserts, vial septa, and the disposable Pasteur pipettes (used for aliquoting) overnight at 130 °C in a glassware oven.
However, the interfering siloxanes were still evident. The vial septa initially used were of the common sandwich type consisting of 1 mm of silicone rubber with a layer of PTFE on the bottom side facing the sample liquid (part number 5185-5820). It was determined that each time the autosampler syringe needle pierced the septum, a microscopic particle of silicone rubber was deposited into the sample. The solvent then leached the siloxanes from the particles.
Conclusion
The Agilent 5977C GC/MSD and 8890 GC, when used with the method described in this application note, provide excellent peak shape, resolution, and sensitivity. The combination of hydrogen carrier and the Agilent J&W HP-5ms 180 µm diameter column allowed for reduced analysis times relative to helium. Calibration curves were linear for 14 of the phthalates from 1 to 1,000 pg. DMEP and DBEP required quadratic curve fits, and DMEP and DEHP were calibrated from 2.5 to 1,000 pg. DINP and DIDP were calibrated from 50 to 20,000 pg with a linear fit. Specific attention to the consumables used and their preparation before use is important for reaching the lowest calibration levels.
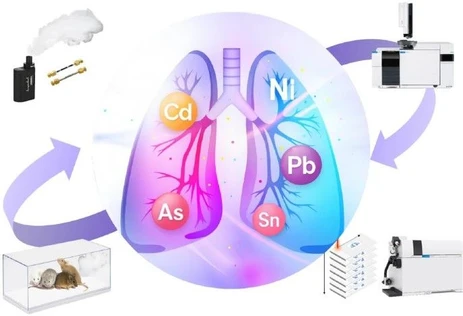
2. University of Alberta / MDCW: Investigating Impacts of Cannabis Tobacco and Vapes on Lung Cells Using GC×GC-MS
- Presentation
- Full PDF for download
Background and Motivation
Smoking is a leading cause of severe diseases such as heart disease, stroke, and lung cancer. As traditional cigarette use declines, vaping and cannabis consumption are on the rise, yet their long-term health effects remain poorly understood. This study aims to fill that gap by evaluating how these exposures affect lung cell metabolism, using comprehensive two-dimensional gas chromatography–mass spectrometry (GC×GC-MS).
Experimental Approach
Researchers developed a custom smoking machine with controlled temperature and airflow to expose lung cell cultures (ePNECs and HBECs) to smoke from cigarettes, cannabis, and vapes. Two main experiments were conducted: one varied incubation times (2h vs. 6h), and the other compared healthy vs. asthmatic cell responses. Sample preparation involved extraction, derivatization, and incubation before GC×GC-MS analysis.
Key Findings
- Time-based metabolic changes: After 2 hours, changes in mRNA expression were evident, while protein changes appeared at 6 hours.
- Cigarette-specific compounds: Compounds such as nicotine, monoacetin, propylene glycol, and putrescine were uniquely abundant in cigarette-exposed samples, especially in ePNEC cells.
- Exciting biomarker pathways: Metabolites like L-phenylalanine and tyrosine—linked to neurotransmitter synthesis (dopamine, norepinephrine, etc.)—were notably altered, suggesting impacts on neurological or endocrine functions.
- Cell type and health condition matters: Metabolic response patterns were more influenced by cell type than by exposure type. Asthmatic and healthy cells responded differently to smoke and vapor.
Methodological Refinements and Challenges
To improve exposure consistency, researchers engineered a 3D-printed plate enclosure to address concerns over smoke gradients and potential contamination from plate surfaces. This innovation aims to enhance experimental control in future studies.
Conclusion and Next Steps
The GC×GC-MS approach successfully revealed significant metabolic shifts in lung cells following exposure to smoking and vaping products. With improved methodology, this line of research holds promise for deeper investigations into the health risks of emerging inhaled products.
3. Shimadzu: Analysis of THC Metabolites in Urine by GC/MS-Scan
- Application note
- Full PDF for download
User Benefits:
- GC/MS-scan analysis can obtain mass spectral data, which improves the reliability of drug testing.
- GC/MS-scan offers quantitative accuracy at ppb concentration levels sufficient for confirmation testing of initial
screening results.
Cannabis contains over 100 different cannabinoids. The main psychoactive component of cannabis, delta-9- tetrahydrocannabinol (Δ9-THC), affectsthe central nervoussystem causing symptoms such as hallucinations, pain relief, and sedation. Conversely, cannabidiol (CBD) has no hallucinatory effects, is not regulated in many countries, and is starting to be used in a variety of applications, including seizure medication, cosmetics, and supplements. Restrictions on cannabis are undergoing continuous reforms with some countries tightening restrictions and others relaxing them. In Japan, restrictions on cannabis for medical use are being relaxed, while laws were recently amended to tighten regulations on cannabis use and a portion of these laws went into effect in December 2024. Cannabis for recreational use is still prohibited in more than half of the countries in the world.
The main restricted component of cannabis is Δ9-THC, which is metabolized in the body and principally excreted in urine and feces as the metabolites Δ9-OH-THC, Δ9-THC-COOH, and their glucuronide conjugates. 1) Based on this, urine must be analyzed for these metabolites to prove cannabis use. Although LCMS/MS offers the advantage of relatively simple sample pretreatment and is the prevailing technique used to test for cannabis metabolites in urine, GC-MS methods can record the full mass spectrum, which can be used to confirm the initial screeningresults.
This Application News describes the analysis of cannabis metabolites in urine using a GC/MS-scan method. GC/MS-scan analysis can identify cannabis metabolites at sub-ppb levels in urine. GC/MS-scan analysis also produces highly repeatable and consistent quantitative data with low intra-day variability.
Analytical Conditions
Analytical conditions are shown in Table 1. This Application News used GCMS-TQ8040 NX, but GCMS-QP2020 NX and GCMS-QP2050 can also be used forthe same analysis.
Results
Representative chromatographic separation pattern was obtained by analyzing a spiked urine sample (100 ng/mL) to obtain the total ion current chromatogram (TICC) and mass chromatograms as shown in Fig. 2. Although the target compounds and the internal standards are in close proximity on the chromatogram,they can be readily separated by mass.
Sensitive Enough for Mass Spectrum-Based Confirmation Fig. 3 shows the mass spectra and mass chromatograms for each target compound in urine samples spiked at 15 ng/mL. The S/N of all mass chromatograms was 68.2 or higher, demonstrating sufficient sensitivity for all target compounds. Fig. 3 compares the mass spectra obtained from a urine sample containing target compounds at 15 ng/mL with mass spectra obtained from standard solutions at 100 ng/mL. Although overlap between internal standards and sample impurities prevents mass spectrum subtraction from being used with some compounds, in this analysis, ion ratios were determined for ions characteristic to every target compound and spectrumbased cross-referencingwas possible.
Conclusion
This Application News confirms that GC/MS-scan analysis can be used for mass spectrum-based confirmation and offers quantitative accuracy sufficient to measure target compounds in urine at ppb concentration levels. Although the quantitative sensitivity of GC/MS-scan analysis is inferior to that of LC-MS/MS or GC-MS/MS methods, GC/MS-scan analysis records a full mass spectrum that can be cross-referenced to confirm initial screeningresults.