SPME-GC–MS and chemometrics for coffee characterization, classification and authentication

Microchemical Journal, Volume 213, 2025, 113771: Graphical abstract
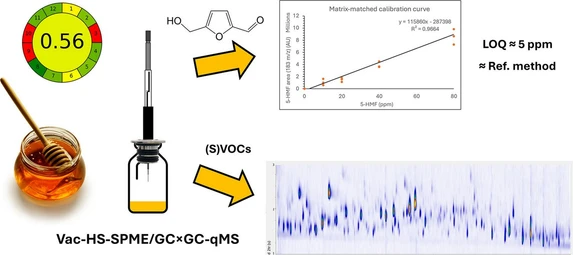
The study aims to address the issue of coffee adulteration by developing a method for reliable detection and classification of authentic and adulterated coffee. By analyzing volatile compound fingerprints from 185 coffee-related samples using SPME-GC–MS and chemometric tools, the research establishes chemical profiles that distinguish between coffee types, species, and origins.
Additionally, the study evaluates the feasibility of using partial least squares regression to quantify adulterant levels in coffee blends. The method proves effective for detecting adulteration levels up to 15%, with calibration and prediction errors kept under 2.9% and 7.4%, respectively.
The original article
SPME-GC–MS and chemometrics for coffee characterization, classification and authentication
Nerea Núñez, Erica Moret, Paolo Lucci, Sabrina Moret, Javier Saurina, Oscar Núñez
Microchemical Journal, Volume 213, 2025, 113771
https://doi.org/10.1016/j.microc.2025.113771
licensed under CC-BY 4.0
Selected sections from the article follow. Formats and hyperlinks were adapted from the original.
Coffee contains a large number of bioactive substances with antioxidant activity, recognized for its beneficial effects on health. Some studies link its consumption with the reduction of the development of some serious diseases such as type II diabetes, cancer and some cardiovascular diseases. Furthermore, coffee contains volatile compounds responsible for its characteristic aroma and significantly contribute to its sensory profile. The content of these substances and, consequently, the characteristics of coffee may vary depending on factors such as variety, origin, and climate, among others [4,6,8,9].
Unfortunately, coffee adulteration is on the rise, leading to cases of food fraud due to the coffee vulnerability and the complexity of the food chain. For that reason, determining the authenticity of coffees by analytical methodologies is crucial to ensure their quality [10].
Several studies in the literature have analyzed volatile compounds using analytical techniques. For instance, Claro et al. [11] employed spectrophotometry and chromatography techniques (Liquid Chromatography coupled to Ultraviolet–Visible, LC-UV–Vis, and Headspace Gas Chromatography coupled to Flame Ionization Detection, HS-GC-FID) combined with chemometrics to determine the compound profiles in green coffee beans and differentiate them into special or traditional categories. Similarly, Mannino et al. [12] utilized high-throughput metabolomics, including High-Performance Liquid Chromatography coupled to Diode-Array Detection and Tandem Mass Spectrometry (HPLC-DAD-MS/MS), Gas Chromatography coupled to Mass Spectrometry (GC–MS), and Polymerase Chain Reaction coupled to Restriction Fragment Length Polymorphism (PCR-RFLP) fingerprinting, to distinguish between different coffee species and origins, providing insights into the volatile profiles and genetic markers of Coffea arabica and Coffea canephora. In another study, Pasias et al. [13] developed a rapid GC-FID method to determine caffeine levels in coffee grains. Additionally, Gamal et al. [14] optimized GC–MS/MS and LC-MS/MS methods to detect organic contaminants in green and roasted coffee, identifying various pesticides and PCBs. In another work, the variability of volatile compounds in roasted coffee was explored by Caporaso et al. [15], who used SPME-GC–MS to analyze the flavor profiles of Arabica and Robusta beans, revealing significant intra-batch and inter-batch variability and the potential for classification based on geographical origin and species. Lastly, Zhang et al. [16] analyzed the flavor characteristics of cold brew coffee using GC–MS and electronic nose and tongue techniques, focusing on how roasting degrees and freeze-drying processes influence the aroma.
In this study, a non-targeted method of headspace-solid phase microextraction with gas chromatography coupled to mass spectrometry (HS-SPME-GC–MS) has been developed to achieve the characterization, classification, and authentication of different coffee samples according to geographical production region, and variety (arabica/robusta). Moreover, decaffeinated and non-decaffeinated instant coffee samples were analyzed. Some samples of chicory, a potential coffee adulterant, have also been considered. The GC–MS fingerprints have been utilized as descriptors of chemical information to address the characterization and classification of the analyzed coffees using principal component analysis (PCA), partial least squares-discriminant analysis (PLS-DA) and partial least squares (PLS) regression.
2. Materials and methods
2.3. Instrumentation
Two GC–MS methods were employed to obtain the chromatographic fingerprints with a GC–MS instrument (Agilent Technologies, Santa Clara, CA, USA) equipped with gas chromatograph (model 7890B) and a selective mass quadripolar detector (model 5977A).
For the first methodology, the chromatographic separation was carried out in a polar UF-WAX ms (60 m × 0.25 mm, 0.25 μm) column from Agilent. For the other method, the chromatographic separation was performed in a non-polar DB-5 ms (30 m × 0.25 mm, 0.5 μm) column from Agilent. The polar column (UF-WAX ms) was used to separate polar compounds, while the non-polar column (DB-5 ms) captured non-polar compounds. This complementarity allowed for a more thorough evaluation of the volatile profiles under different chromatographic conditions and provided insight into how each column influences the detection and classification of coffee samples. In both cases, helium was the carrier gas. The temperature was initially maintained at 40 °C for 2 min, then increased to 200 °C at a rate of 3 °C/min until min 60; subsequently, it raised to 250 °C at 10 °C/min until min 70, and finally held at 250 °C for 5 min. An electron ionization (EI) source at 70 eV was employed. The temperatures of the ionization source and the quadrupole were 230 °C and 150 °C, respectively. Full scan data (m/z: 50–650) were acquired in positive acquisition mode.
The GC–MS conditions were based on a previously established methodology in the literature by Kim et al., optimized for the analysis of volatile compounds in food matrices. Preliminary tests were conducted to compare the split and splitless injection modes, with the splitless mode being ultimately selected due to its higher sensitivity for detecting minor volatile compounds. Once optimized for the UF-WAX column, the same conditions were applied to the DB-5 column to ensure consistency between the methods.
3. Results and discussion
3.1. Non-targeted HS-SPME-GC–MS fingerprints
The main objective of this study was to obtain GC–MS fingerprints of different coffee and chicory samples for their classification and authentication. Two methodologies were proposed to obtain GC–MS fingerprints rich in volatile compounds.
Chromatographic separation was carried out using a polar UF-WAX ms column in the first method and a non-polar DB-5 column in the second method, both employing helium as a carrier gas. The optimal temperature conditions of the method were selected considering the detected signals for each sample type and the total analysis time.
The obtained GC–MS fingerprints, for both employed columns, constitute an intricate system, giving place to ca. 10,000 features per sample, reflecting the chemical diversity of the analyzed samples. Notable differences are observed (Fig. 1) between the chromatograms generated using the polar and non-polar column, highlighting how the selectivity of each column influences compound retention and resolution. Chromatograms from the polar column tend to show a more uniform distribution of peaks, with a higher number of signals spread across the retention time. In contrast, for the non-polar column, compounds are primarily observed between 2 and 40 min. In the Vietnamese Arabica coffee samples, Vietnamese Robusta coffee samples, Cambodian coffee samples, and Costa Rica coffee samples, high-intensity peaks are observed in similar intervals and small peak signals shown differences between samples. On the other hand, decaffeinated and regular soluble coffees exhibit simpler profiles with a lower density of peaks, likely reflecting the loss of volatile compounds during industrial processing. Chicory, in contrast, presents a distinctive chromatographic profile with specific signals that may be associated with its unique compounds. It is important to highlight that the GC–MS fingerprints are reproducible within samples of the same category, making them reliable chemical descriptors to address sample classification using chemometric methods.
 Microchemical Journal, Volume 213, 2025, 113771: Fig. 1. GC–MS total ion chromatograms (a) polar column and (b) non-polar column for chicory, Vietnamese Arabica coffee, Vietnamese Robusta coffee, Cambodian Coffee, Costa Rica coffee, soluble non-decaffeinated coffee and soluble decaffeinated coffee.
3.2. PCA exploration
The potential of non-targeted GC–MS fingerprints as chemical descriptors was initially assessed through PCA. Data matrices (X-data) were constructed using the intensity signals at each m/z and retention time for all samples under analysis. Furthermore, an autoscaling preprocessing method was employed to ensure equal weighting for all variables.
Fig. 2 depicts the PCA score plots from non-targeted GC–MS fingerprints using both UF-WAX ms and DB-5 ms columns. For the polar column, Fig. a.1 shows all analyzed coffees vs. chicory samples, Fig. a.2 shows non-soluble coffees vs. soluble coffees, and Fig. a.3 shows soluble decaffeinated coffees vs. non-decaffeinated soluble coffees. Figs. b.1, b.2 and b.3 show the equivalent information for the non-polar column. Similar PCA information is provided for exploring coffees regarding the variety (Arabica, Robusta and Arabica-Robusta mixture) and the geographical origin region in Figs. S2 and S3 (supplementary material), respectively.
 Microchemical Journal, Volume 213, 2025, 113771: Fig. 2. PCA score plots using GC–MS fingerprints from (a) polar column and (b) non-polar columns. (a.1) Coffees vs. Chicory (score plot of PC1 vs. PC2), (a.2) Coffee vs. soluble Coffee (score plot of PC1 vs. PC2), and (a.3) Soluble non-decaffeinated Coffee vs. soluble decaffeinated coffee (score plot of PC1 vs. PC2); (b.1) All Coffee vs. Chicory (score plot of PC1 vs. PC2 vs. PC3), (b.2) Coffee vs. soluble Coffee (score plot of PC1 vs. PC2), and (b.3) Soluble non-decaffeinated Coffee vs. soluble decaffeinated coffee (score plot of PC1 vs. PC2 vs. PC3).
Regarding the distribution of the samples, the plots of scores (Fig. 2) show that chicory samples are satisfactorily discriminated from coffee samples when both GC methods are employed. As shown in Fig. 2.a.1 and 2.b.1, chicory and coffee samples are grouped according to their class, achieving better separation with the non-polar column (DB5). This separation is further emphasized by the fact that chicory and coffee samples are located in different regions of scores’ plot, suggesting a significant chemical difference between the two categories. For coffee typology, Fig. 2.a.2 and 2.b.2 show a perfect discrimination when comparing soluble and non-soluble coffees for both GC–MS methods, indicating a clear separation based on volatolomics.
For the specific case of coffee samples analyzed with the WAX column, the samples are distributed along PC1, while for the DB5 column, the samples are mainly grouped according to PC2, in both cases located in the positive value region. However, in the case of soluble coffees (both regular and decaffeinated), the discrimination of the samples is less clear, as some overlap between the sample groups is observed, regardless of the GC–MS method used. This overlap suggests that the variability in soluble coffee is higher than in the ground (normal) counterpart, which could indicate greater heterogeneity in soluble coffee due to the manufacturing process.
Regarding the coffee classifying based on variety, Fig. S2 shows that coffee samples containing a mix of Arabica and Robusta varieties are located approximately at the center of the plot, positioned between pure Arabica and Robusta types as expected. The 100 % Arabica and 100 % Robusta samples show clear grouping, with a distribution reflecting opposite trends between them, particularly in the principal components PC1 and PC2. This distribution pattern confirms the chemical and profile differences between the two coffee varieties.
Finally, Fig. S3 shows that, although there is some overlap between samples, particularly between coffees from Vietnam and Cambodia, the samples are correctly grouped according to their geographic region of origin. This result supports the hypothesis that geographic origin significantly influences the chemical characteristics of the samples, which is reflected in the PCA's ability to group the samples effectively based on their origin. The presence of overlaps may be attributed to the possible similarity in the growing and processing conditions of coffees from these two regions, which could make their chemical profiles more similar.
6. Conclusions
Two GC–MS methods have been proposed to obtain HS-SPME-GC–MS fingerprints providing chemical descriptors of the samples suitable for the characterization, classification, and authentication of coffee samples of different types, varieties, and origins, as well as for discriminating coffee with chicory (one of its possible adulterants).
Chemometric analysis by PCA using the HS-SPME-GC–MS fingerprints show good discrimination capabilities between coffee and chicory and between coffee varieties with the two GC–MS methodologies (with polar or non-polar column).
The PLS-DA models showed very good results providing sensitivity and specificity values greater than 93.3 % and 94.5 %, respectively. Furthermore, PLS-DA paired models simulating an external validation provided excellent results, with sensitivity and specificity values of 100 % when coffee is classified in front chicory and when non-soluble coffee is classified in front soluble coffee. For soluble decaffeinated and non-decaffeinated coffees, prediction values higher of 85.7 % were obtained. For coffee varieties, sensitivity values of 100 % and specificity values higher than 93.3 % were observed. Finally, for geographical production regions, sensitivity values of 100 % and specificity values higher than 95.7 % were achieved.
The capability of the proposed methods to detect and quantify coffee frauds through multivariate PLS regression was studied for two adulteration cases: Vietnamese Arabica Coffee adulterated with Vietnamese Robusta Coffee and Vietnamese Robusta Coffee adulterated with chicory. Very acceptable calibration and prediction errors were accomplished, lower than 2.9 % and 7.4 %, respectively. Hence, the HS-SPMEGC-MS methodologies combined with chemometrics are good strategies to authenticate coffee and to detect and quantify coffee frauds.
Additionally, the identification of volatile compounds in the samples provides a detailed understanding of the characteristic aromatic profiles of each coffee type. These results allow for the correlation of the complexity and diversity of coffee aromas and flavors with their chemical composition, highlighting the utility of the HS-SPME-GC/MS technique for sensory studies and authenticity in coffee. Moreover, the precise identification of volatile compounds opens the door to future studies dealing with agricultural and processing practices, thereby improving coffee quality and meeting consumer expectations in a constantly evolving market.
Furthermore, although our study does not directly measure aroma or taste, it is well established in the literature that volatile compounds such as esters, aldehydes, and pyrazines play crucial roles in the aroma and flavor profiles of coffee. Previous studies have demonstrated a direct link between volatile compounds and sensory attributes, supporting the idea that the chemical profiles obtained here could offer insights into the sensory qualities of the coffee samples. In future research, it would be valuable to combine chemical profiling with sensory analysis to further correlate these findings.
Finally, AGREE and BAGI evaluations demonstrate that the employed HS-SPME-GC–MS approach is both environmentally sustainable (AGREE score: 0.79) and highly applicable for routine analysis (BAGI score: 62.5/100). These findings reinforce its potential as a robust, scalable, and eco-friendly alternative for coffee authentication and adulteration detection, bridging the gap between sustainability and analytical efficiency.